

Executive thesis
The recovery is real enough to measure—and fragile enough to interrupt.
U.S. tariff
On roughly $28B of Canadian goods, according to the Prime Minister’s August 21 statement.
July CPI
But CPI excluding gasoline held at 2.2% for a third month.
July employment
Unemployment eased to 6.4%; wage growth cooled to 2.8%.
Home sales, MoM
The fourth consecutive seasonally adjusted gain, according to CREA.
Canada entered this call with more momentum than it had at the start of summer. Employment rose, May GDP expanded, national home sales increased for a fourth straight month, new listings fell, and the MLS benchmark price finally edged higher month over month.
Then trade risk returned. The new tariff is narrower than an across-the-board tax on every Canadian export, but it lands on an economy whose recovery is still shallow. It raises the chance that the same places already wrestling with soft resale markets—especially Ontario’s manufacturing corridor—face a new employment and confidence shock.
The operating conclusion is not “Canada is back” or “Canada is broken.” It is that the country has moved from broad deterioration to a regional, inventory-sensitive stabilization. The national average now hides more than it explains.
The exposure map is local, not national.
On August 21, Prime Minister Mark Carney said Canada–U.S. talks had been suspended and that the United States would impose a 50% tariff on roughly $28 billion of Canadian goods. First Ministers said Canada’s matching response would take effect on the Tuesday after Labour Day. The first-round effect will depend on the product list, exemptions, exchange rate and how long the measures remain in force.
The Canadian Chamber of Commerce Business Data Lab gives us the better geographic frame. Its exposure index combines two ideas: how large U.S.-bound exports are relative to a city’s economy, and how dependent that city’s export mix is on the United States. That is why exposure concentrates in industrial and commodity-linked centres rather than simply tracking city size.
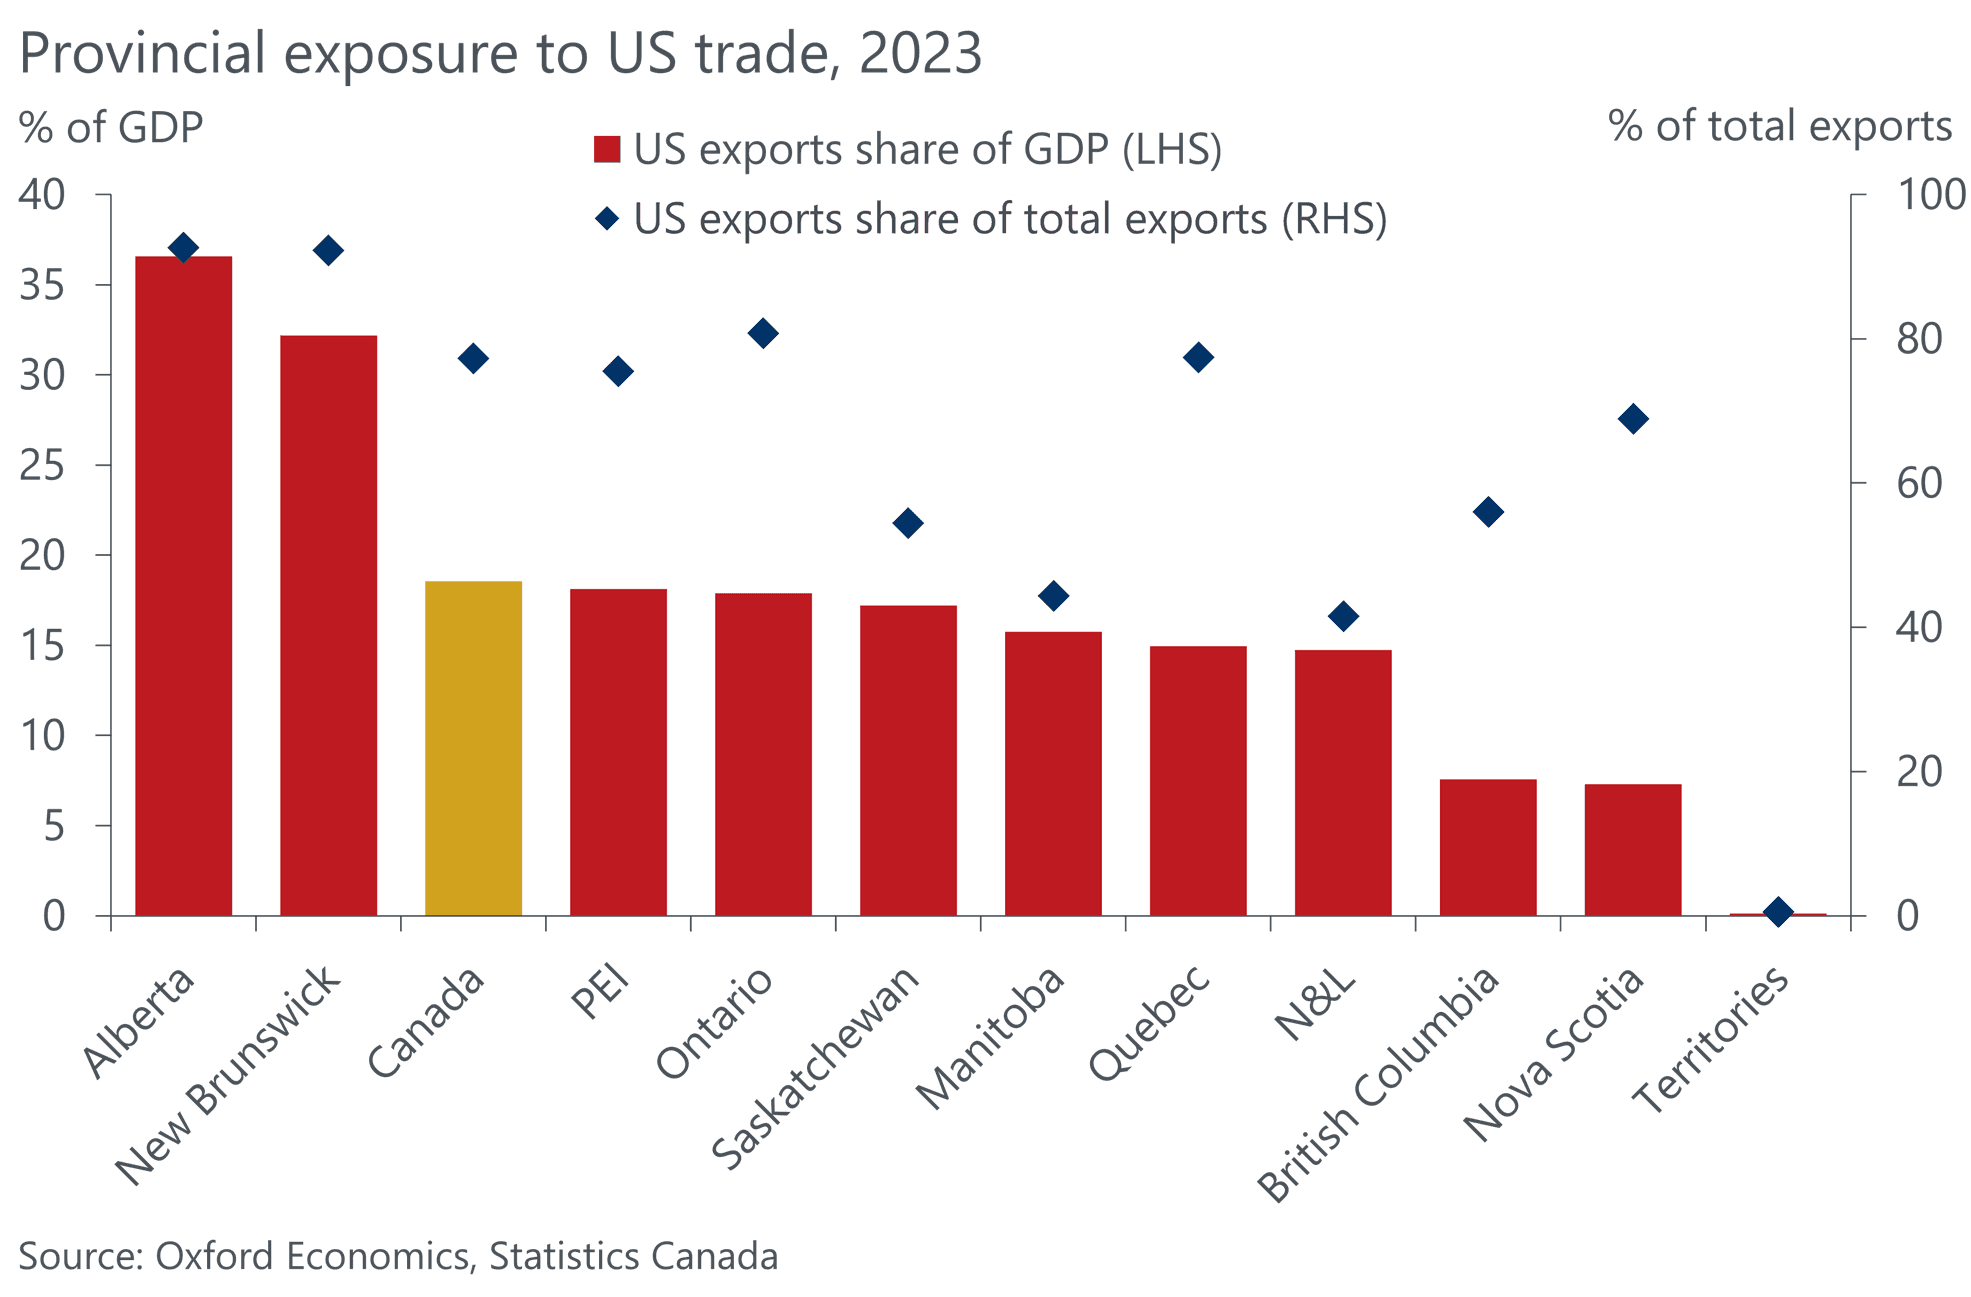
Oxford Economics reaches a similar geographic conclusion with a different measure. Using 2023 trade data and its metro estimates, it says U.S.-bound exports were tied to more than 60% of GDP in Calgary, Saint John and Windsor. Calgary carried an estimated $114 billion in U.S. exports, compared with $89 billion in Toronto and $45 billion in Montréal; Vancouver’s U.S.-bound exports were only 5% of local GDP. Business Data Lab is a structural index, while Oxford estimates trade value and local-GDP exposure. Neither is a forecast of realized 2026 job or housing losses.
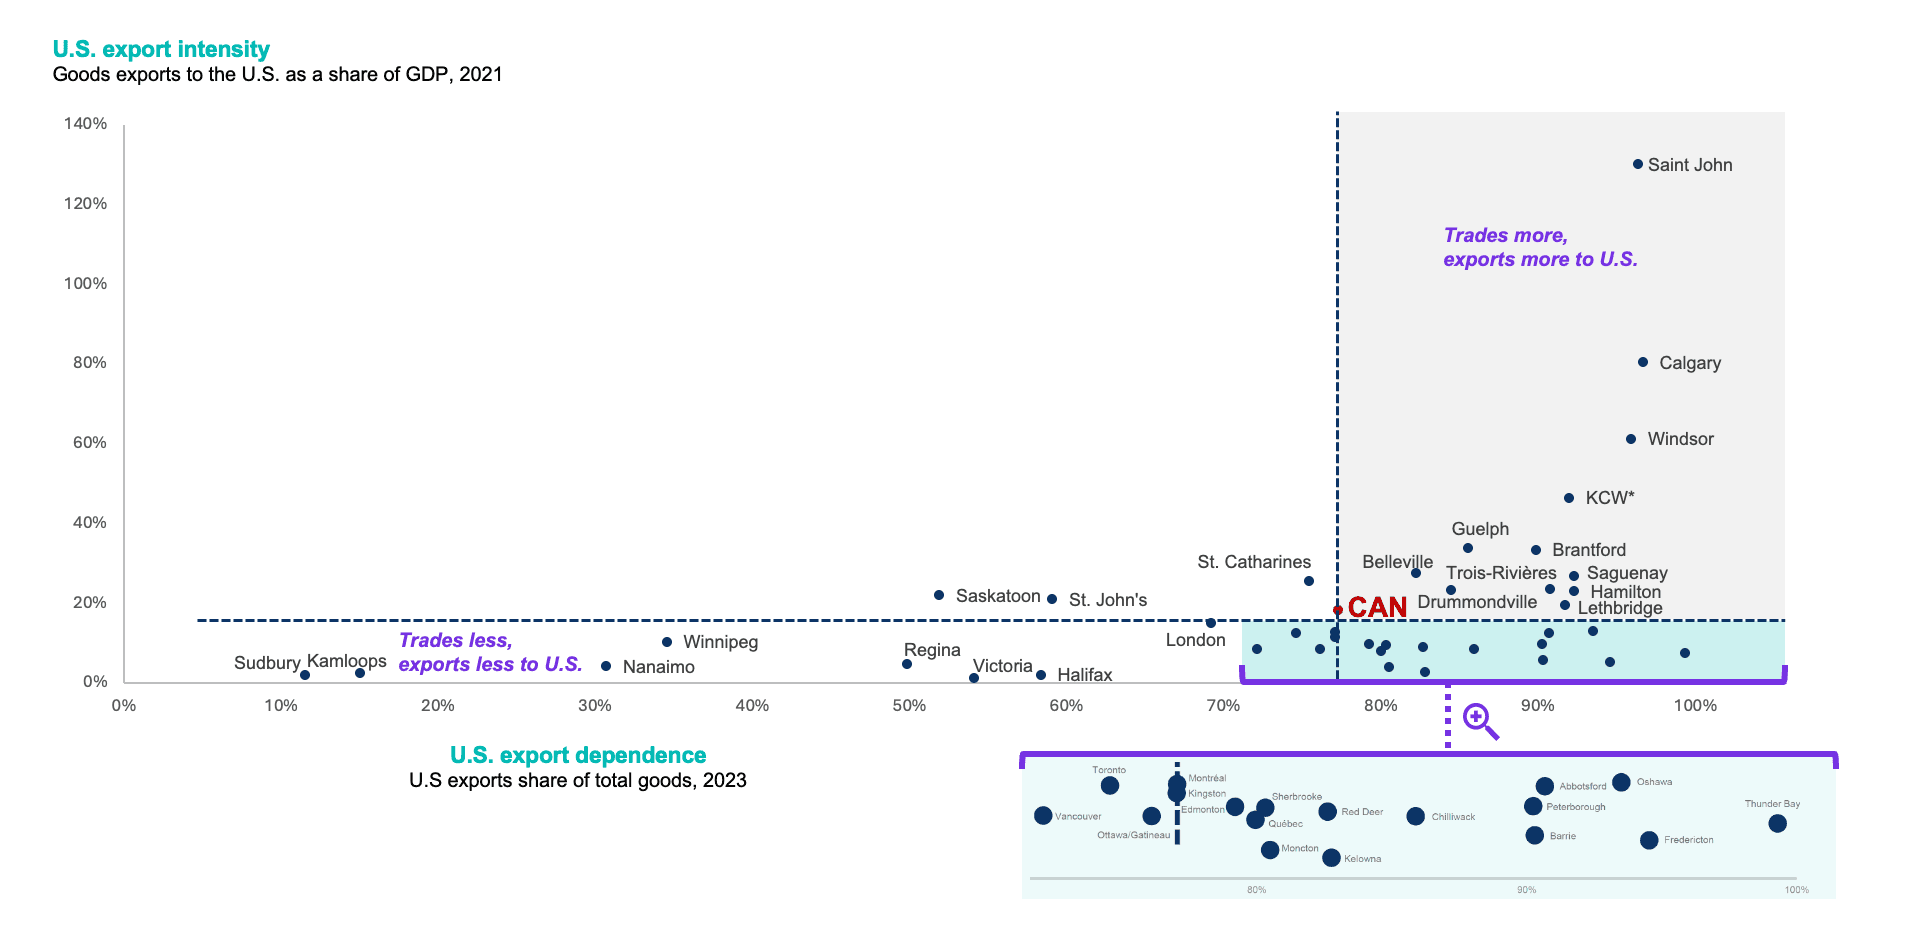
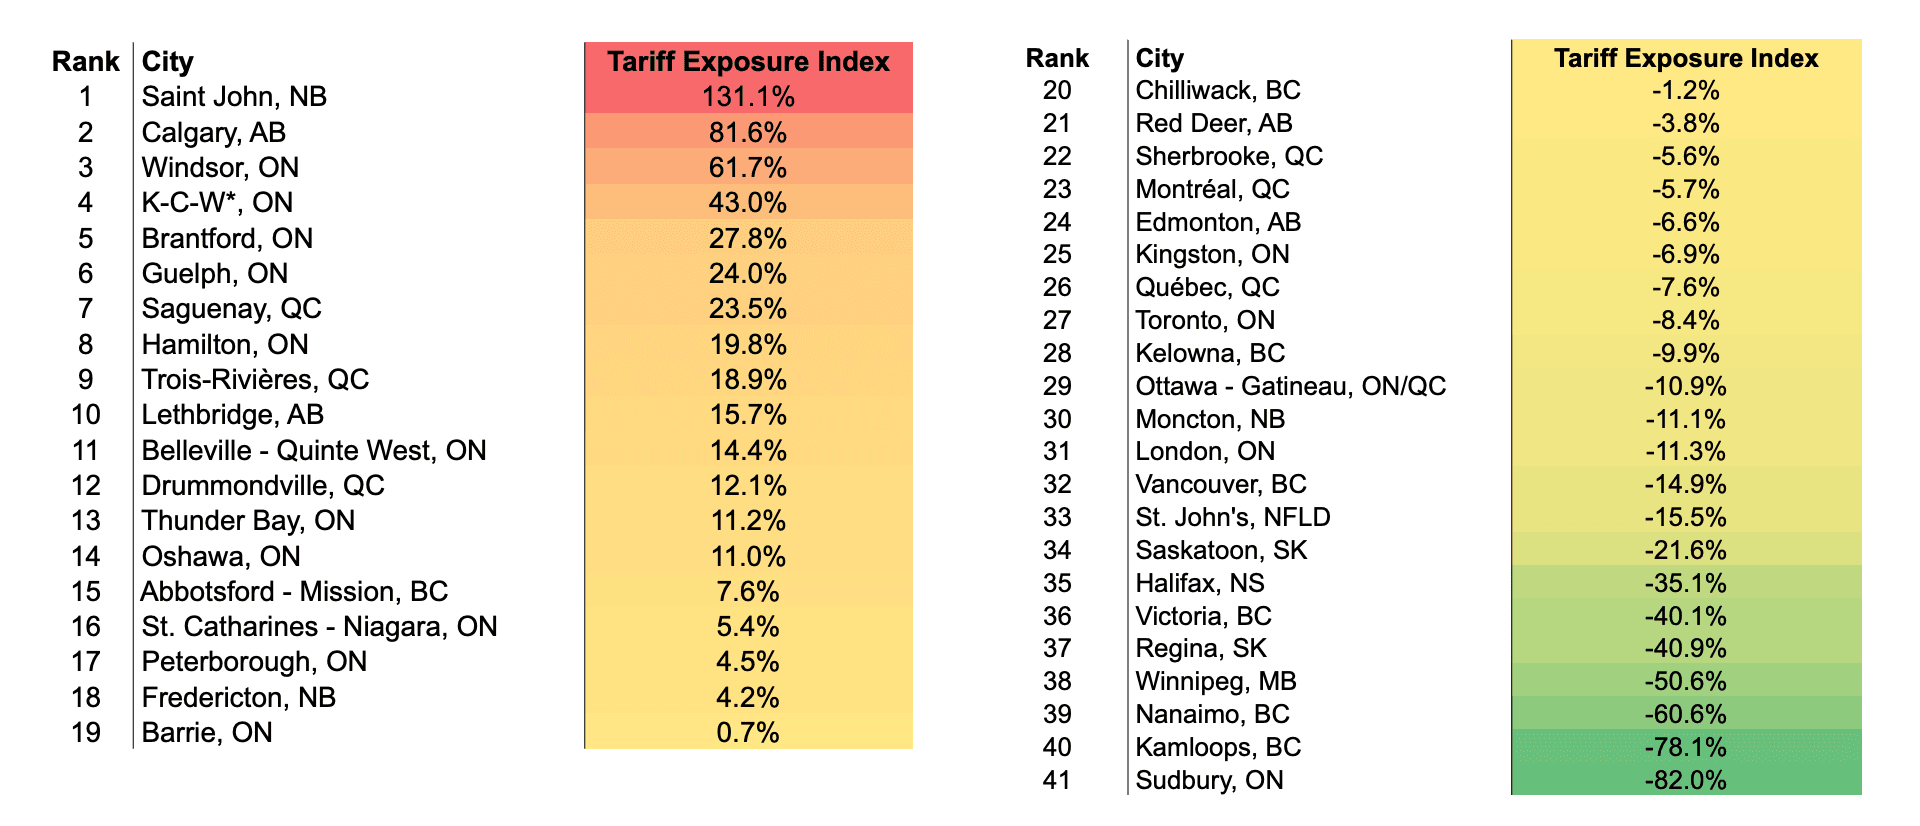
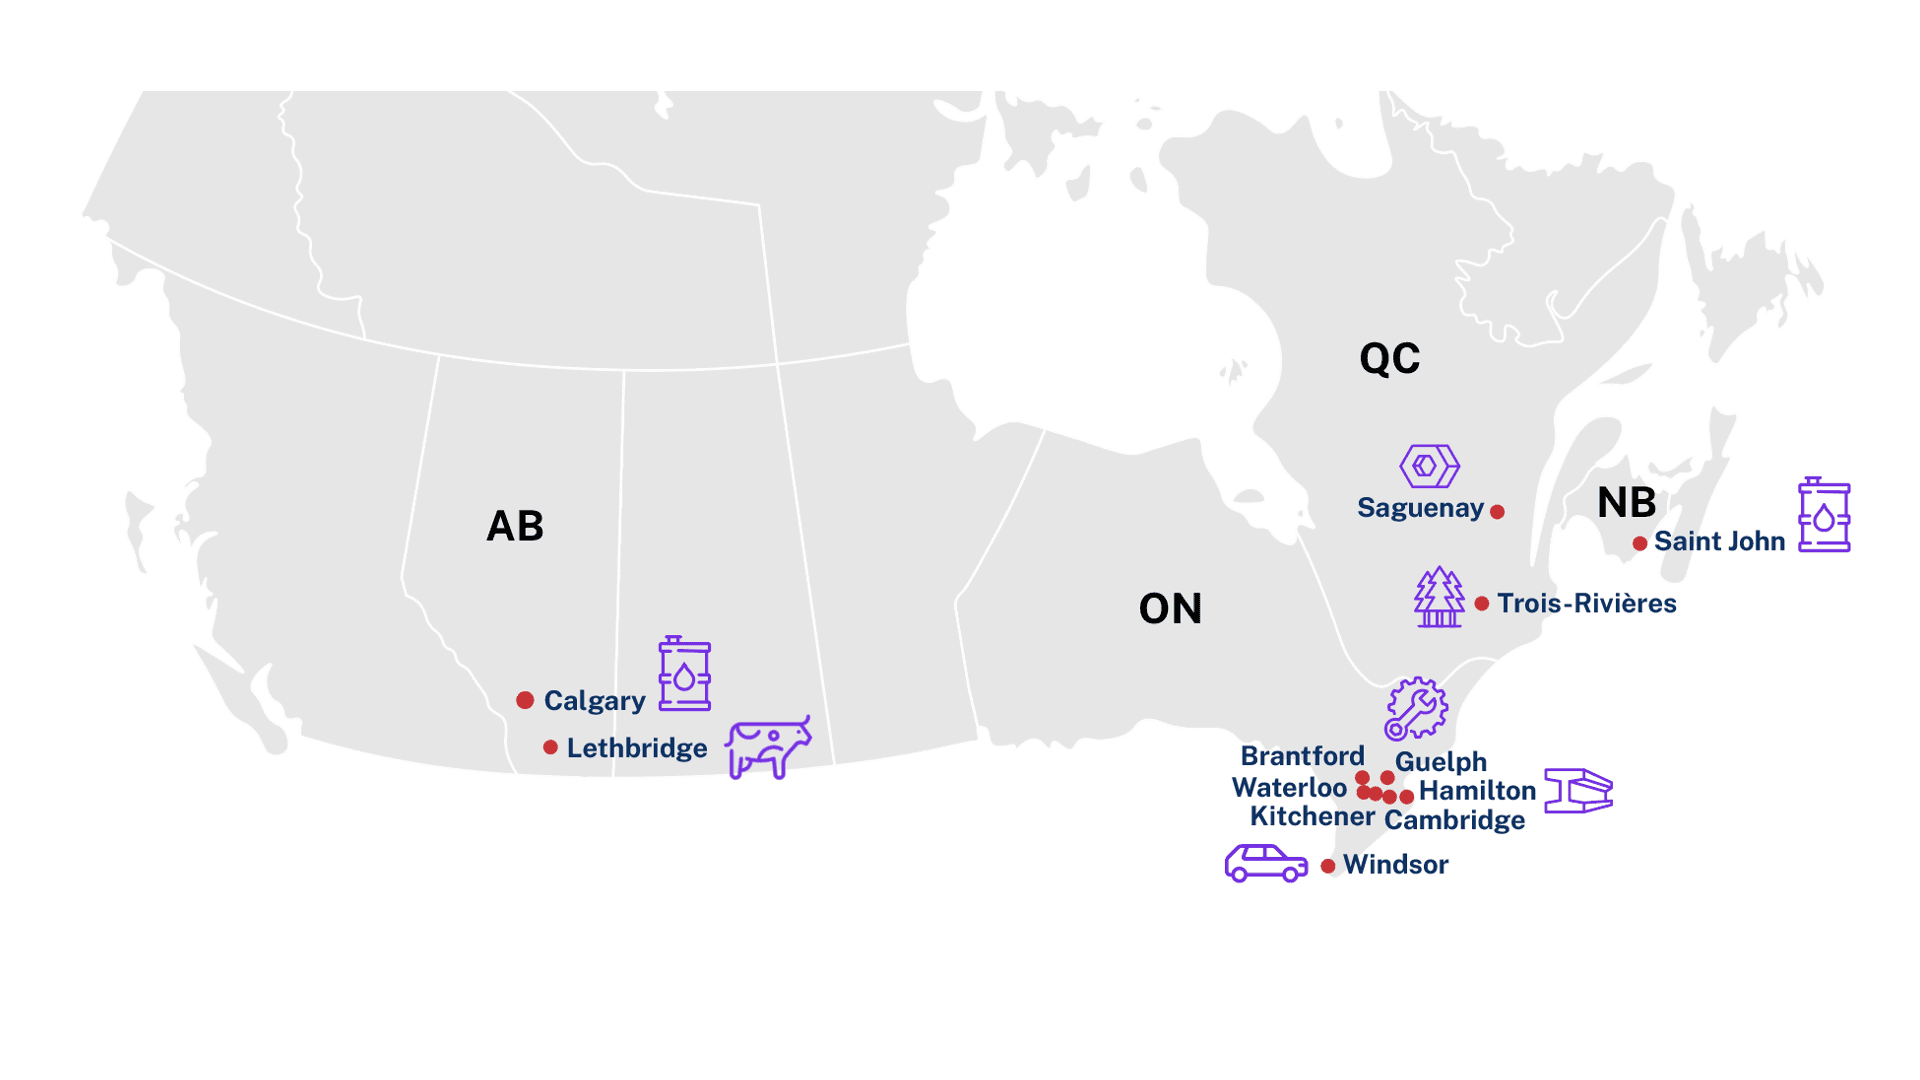
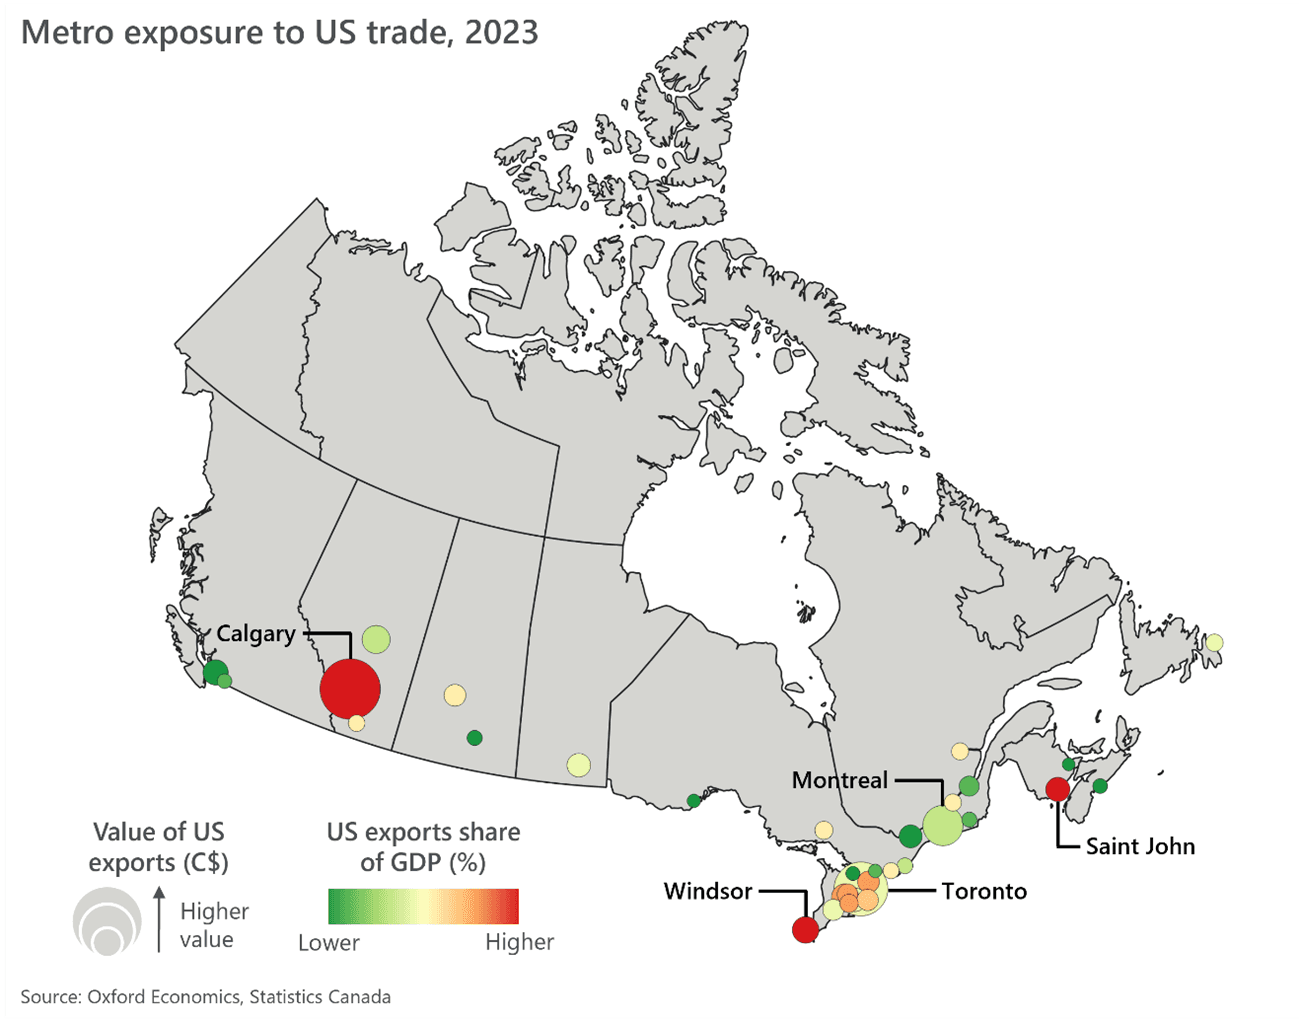
The provincial view separates trade intensity from trade dependence. Oxford estimates that U.S.-bound exports exceeded 30% of GDP in Alberta and New Brunswick in 2023, while more than 90% of each province's exports went to the United States. Ontario's exposure is different: it has the largest dollar value of U.S.-bound exports, but a broader domestic economy lowers the share of provincial GDP at risk.
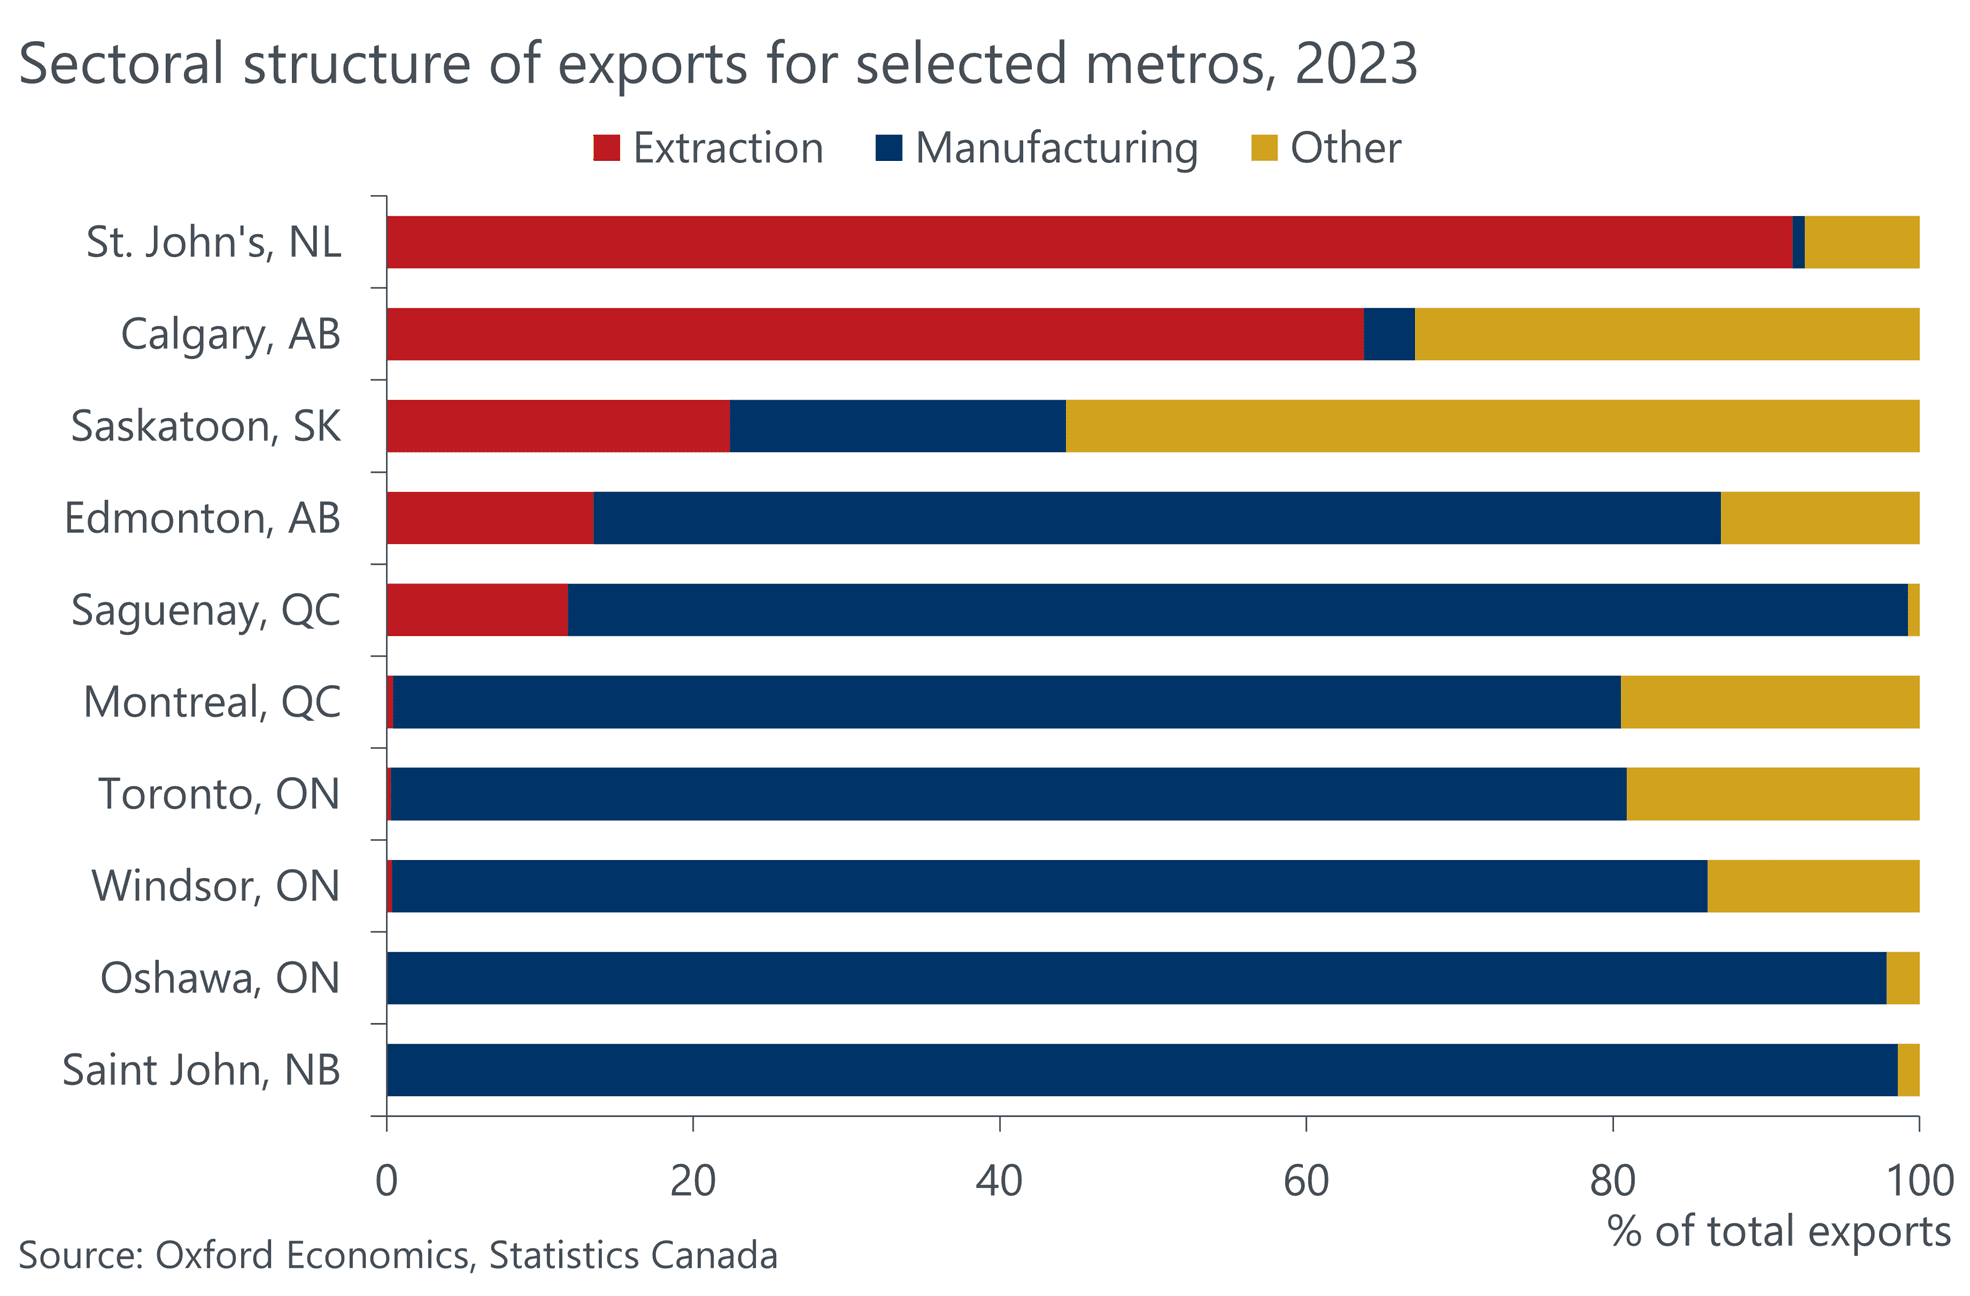
Sector mix determines how that exposure transmits. Extraction dominates exports from St. John's and Calgary, while manufacturing dominates Saint John, Windsor and Oshawa. Energy exemptions could cushion extraction-heavy metros; steel, aluminum or automotive tariffs would concentrate the shock in manufacturing corridors. The product list matters as much as the headline tariff rate.
Housing implication
Watch employment and new listings in Windsor–Kitchener–Guelph–Hamilton first. Calgary’s ranking is high because energy exports matter to the local economy, but the price shock can run differently there: a weaker Canadian dollar or higher commodity revenue can offset some tariff damage. Exposure is not destiny; it tells us where to monitor the transmission.
The headline data improved. The mix is still cautious.
CPI: July inflation rose to 3.0% from 2.8%, but gasoline was up 25.7% year over year. CPI excluding gasoline remained 2.2%. Shelter inflation slowed to 1.3%, while travel tours and air transportation accelerated. The headline is uncomfortable; the breadth is less alarming than the top line suggests.
Labour: Employment increased by 75,000 and the unemployment rate eased to 6.4%. Private-sector employment rose by 58,000 and self-employment by 44,000, while public-sector employment fell by 27,000. The better headline matters, but public-sector softness is relevant for Ottawa and other government-heavy markets.
GDP: Real GDP by industry grew 0.3% in May, with 13 of 20 sectors advancing. Residential building rose 1.1%, real estate/rental/leasing 0.4%, and offices of real estate agents and brokers 5.1%. Official June and second-quarter GDP were scheduled after this call, so Statistics Canada’s +0.2% June and +0.8% Q2 advance indications remain preliminary.
Inflation pressure map
Toggle headline, shelter, energy, gasoline and mortgage-interest cost inflation. Hover, touch or use the keyboard to inspect any month; download the frozen series or open its data table.
Year-over-year change calculated from Statistics Canada CPI indexes via stats.realist.ca.
Download CSVView accessible data table
| Month | All-items | Shelter | Energy |
|---|---|---|---|
| Jul 26 | +3.0% | +1.3% | +16.6% |
| Jun 26 | +2.8% | +1.5% | +14.3% |
| May 26 | +3.2% | +1.7% | +22.2% |
| Apr 26 | +2.8% | +1.8% | +19.2% |
| Mar 26 | +2.4% | +1.7% | +3.9% |
| Feb 26 | +1.8% | +1.5% | -9.3% |
| Jan 26 | +2.3% | +1.7% | -10.9% |
| Dec 25 | +2.4% | +2.1% | -8.8% |
| Nov 25 | +2.2% | +2.3% | -5.1% |
| Oct 25 | +2.2% | +2.5% | -6.5% |
| Sep 25 | +2.4% | +2.6% | -2.6% |
| Aug 25 | +1.9% | +2.6% | -8.3% |
| Jul 25 | +1.7% | +3.0% | -10.4% |
| Jun 25 | +1.9% | +2.9% | -9.5% |
| May 25 | +1.7% | +3.0% | -11.0% |
| Apr 25 | +1.7% | +3.4% | -12.7% |
| Mar 25 | +2.3% | +3.9% | -0.3% |
| Feb 25 | +2.6% | +4.2% | +3.0% |
| Jan 25 | +1.9% | +4.5% | +5.3% |
| Dec 24 | +1.8% | +4.5% | +1.0% |
| Nov 24 | +1.9% | +4.6% | -1.4% |
| Oct 24 | +2.0% | +4.8% | -3.5% |
| Sep 24 | +1.6% | +5.0% | -8.3% |
| Aug 24 | +2.0% | +5.3% | -4.7% |
| Jul 24 | +2.5% | +5.7% | +0.4% |
| Jun 24 | +2.7% | +6.2% | +0.5% |
| May 24 | +2.9% | +6.4% | +4.1% |
| Apr 24 | +2.7% | +6.4% | +4.5% |
| Mar 24 | +2.9% | +6.5% | +2.8% |
| Feb 24 | +2.8% | +6.5% | +1.3% |
| Jan 24 | +2.9% | +6.2% | -2.7% |
| Dec 23 | +3.4% | +6.0% | -0.4% |
| Nov 23 | +3.1% | +5.9% | -5.7% |
| Oct 23 | +3.1% | +6.1% | -5.4% |
| Sep 23 | +3.8% | +6.0% | +5.4% |
| Aug 23 | +4.0% | +6.0% | +1.8% |
| Jul 23 | +3.3% | +5.1% | -8.2% |
| Jun 23 | +2.8% | +4.8% | -14.6% |
| May 23 | +3.4% | +4.7% | -12.4% |
| Apr 23 | +4.4% | +4.9% | -4.2% |
| Mar 23 | +4.3% | +5.4% | -6.9% |
| Feb 23 | +5.2% | +6.1% | -0.6% |
| Jan 23 | +5.9% | +6.6% | +5.4% |
| Dec 22 | +6.3% | +7.0% | +7.3% |
| Nov 22 | +6.8% | +7.2% | +13.9% |
| Oct 22 | +6.9% | +6.9% | +16.2% |
| Sep 22 | +6.9% | +6.8% | +14.0% |
| Aug 22 | +7.0% | +6.6% | +19.0% |
| Jul 22 | +7.6% | +7.0% | +28.0% |
| Jun 22 | +8.1% | +7.1% | +38.8% |
| May 22 | +7.7% | +7.4% | +34.8% |
| Apr 22 | +6.8% | +7.4% | +26.4% |
| Mar 22 | +6.7% | +6.8% | +27.8% |
| Feb 22 | +5.7% | +6.6% | +24.1% |
| Jan 22 | +5.1% | +6.2% | +23.1% |
| Dec 21 | +4.8% | +5.4% | +21.2% |
| Nov 21 | +4.7% | +4.8% | +26.4% |
| Oct 21 | +4.7% | +4.8% | +25.5% |
| Sep 21 | +4.4% | +4.8% | +20.1% |
| Aug 21 | +4.1% | +4.8% | +20.7% |
| Jul 21 | +3.7% | +4.8% | +19.7% |
| Jun 21 | +3.1% | +4.4% | +19.5% |
| May 21 | +3.6% | +4.2% | +26.4% |
| Apr 21 | +3.4% | +3.2% | +32.7% |
| Mar 21 | +2.2% | +2.4% | +19.1% |
| Feb 21 | +1.1% | +1.4% | +2.4% |
| Jan 21 | +1.0% | +1.4% | -2.7% |
| Dec 20 | +0.7% | +1.6% | -4.0% |
| Nov 20 | +1.0% | +1.9% | -5.7% |
| Oct 20 | +0.7% | +1.8% | -6.0% |
| Sep 20 | +0.5% | +1.7% | -5.6% |
| Aug 20 | +0.1% | +1.5% | -6.3% |
| Jul 20 | +0.1% | +1.5% | -8.4% |
| Jun 20 | +0.7% | +1.7% | -8.8% |
| May 20 | -0.4% | +1.0% | -19.0% |
| Apr 20 | -0.2% | +1.3% | -23.7% |
| Mar 20 | +0.9% | +1.9% | -11.6% |
| Feb 20 | +2.2% | +2.3% | +4.3% |
| Jan 20 | +2.4% | +2.4% | +6.8% |
Labour-market pulse
Switch between the unemployment rate and the employment-level index. July improved, but the labour market has not returned to the low-unemployment conditions of 2022–23.
Seasonally adjusted unemployment rate from the Labour Force Survey.
Download CSVView accessible data table
| Month | Unemployment rate |
|---|---|
| Jul 26 | 6.40% |
| Jun 26 | 6.50% |
| May 26 | 6.60% |
| Apr 26 | 6.90% |
| Mar 26 | 6.70% |
| Feb 26 | 6.70% |
| Jan 26 | 6.50% |
| Dec 25 | 6.80% |
| Nov 25 | 6.60% |
| Oct 25 | 6.90% |
| Sep 25 | 7.10% |
| Aug 25 | 7.10% |
| Jul 25 | 6.90% |
| Jun 25 | 6.90% |
| May 25 | 7% |
| Apr 25 | 6.90% |
| Mar 25 | 6.80% |
| Feb 25 | 6.60% |
| Jan 25 | 6.70% |
| Dec 24 | 6.70% |
| Nov 24 | 7% |
| Oct 24 | 6.60% |
| Sep 24 | 6.50% |
| Aug 24 | 6.60% |
| Jul 24 | 6.40% |
| Jun 24 | 6.40% |
| May 24 | 6.30% |
| Apr 24 | 6.20% |
| Mar 24 | 6.10% |
| Feb 24 | 5.90% |
| Jan 24 | 5.70% |
| Dec 23 | 5.80% |
| Nov 23 | 5.80% |
| Oct 23 | 5.70% |
| Sep 23 | 5.50% |
| Aug 23 | 5.40% |
| Jul 23 | 5.40% |
| Jun 23 | 5.40% |
| May 23 | 5.20% |
| Apr 23 | 5.10% |
| Mar 23 | 5.10% |
| Feb 23 | 5.20% |
| Jan 23 | 5.10% |
| Dec 22 | 5% |
| Nov 22 | 5% |
| Oct 22 | 5.10% |
| Sep 22 | 5.10% |
| Aug 22 | 5.20% |
| Jul 22 | 4.80% |
| Jun 22 | 4.90% |
| May 22 | 5.20% |
| Apr 22 | 5.40% |
| Mar 22 | 5.40% |
| Feb 22 | 5.50% |
| Jan 22 | 6.40% |
| Dec 21 | 5.90% |
| Nov 21 | 6.10% |
| Oct 21 | 6.50% |
| Sep 21 | 7% |
| Aug 21 | 7.10% |
| Jul 21 | 7.40% |
| Jun 21 | 7.90% |
| May 21 | 8.30% |
| Apr 21 | 8.20% |
| Mar 21 | 7.70% |
| Feb 21 | 8.50% |
| Jan 21 | 9.20% |
| Dec 20 | 8.90% |
| Nov 20 | 8.60% |
| Oct 20 | 9% |
| Sep 20 | 9.10% |
| Aug 20 | 10.10% |
| Jul 20 | 10.90% |
| Jun 20 | 12.60% |
| May 20 | 14.20% |
| Apr 20 | 13.70% |
| Mar 20 | 8.50% |
| Feb 20 | 5.80% |
| Jan 20 | 5.50% |
GDP recovery by sector
The national line is improving, but energy, construction and real estate are travelling on different paths. Every series is monthly, frozen and downloadable.
Monthly real GDP by industry, indexed to January 2022 = 100.
Download CSVView accessible data table
| Month | All industries | Energy | Construction | Real estate |
|---|---|---|---|---|
| May 26 | 109.3 | 116.3 | 102.6 | 107.5 |
| Apr 26 | 109.0 | 115.0 | 101.7 | 107.0 |
| Mar 26 | 108.3 | 111.7 | 100.4 | 106.8 |
| Feb 26 | 108.5 | 113.0 | 100.9 | 106.6 |
| Jan 26 | 108.3 | 112.5 | 102.2 | 106.6 |
| Dec 25 | 108.3 | 111.7 | 102.3 | 106.8 |
| Nov 25 | 108.2 | 112.2 | 102.7 | 106.8 |
| Oct 25 | 108.1 | 111.4 | 102.5 | 106.7 |
| Sep 25 | 108.4 | 111.8 | 103.4 | 106.5 |
| Aug 25 | 108.2 | 111.4 | 103.5 | 106.6 |
| Jul 25 | 108.2 | 111.7 | 103.0 | 106.3 |
| Jun 25 | 107.6 | 109.4 | 102.2 | 105.8 |
| May 25 | 107.5 | 108.3 | 101.8 | 105.5 |
| Apr 25 | 107.7 | 110.9 | 101.7 | 105.2 |
| Mar 25 | 107.8 | 112.3 | 101.6 | 104.9 |
| Feb 25 | 107.6 | 110.7 | 101.1 | 105.1 |
| Jan 25 | 107.8 | 112.4 | 101.4 | 105.3 |
| Dec 24 | 107.2 | 110.0 | 101.2 | 105.3 |
| Nov 24 | 107.0 | 107.8 | 101.0 | 105.5 |
| Oct 24 | 107.2 | 109.5 | 100.9 | 105.0 |
| Sep 24 | 106.8 | 106.9 | 101.0 | 104.5 |
| Aug 24 | 106.5 | 108.0 | 100.0 | 104.2 |
| Jul 24 | 106.4 | 107.9 | 99.2 | 104.0 |
| Jun 24 | 106.2 | 108.5 | 99.5 | 104.0 |
| May 24 | 105.9 | 106.5 | 100.0 | 103.7 |
| Apr 24 | 105.8 | 106.5 | 100.0 | 103.6 |
| Mar 24 | 105.4 | 105.5 | 100.5 | 103.5 |
| Feb 24 | 105.4 | 105.1 | 99.2 | 103.2 |
| Jan 24 | 104.7 | 102.9 | 98.5 | 103.0 |
| Dec 23 | 104.4 | 106.9 | 98.9 | 102.4 |
| Nov 23 | 104.6 | 106.0 | 99.6 | 101.7 |
| Oct 23 | 104.3 | 103.6 | 99.9 | 101.5 |
| Sep 23 | 104.2 | 103.3 | 100.4 | 101.7 |
| Aug 23 | 104.2 | 104.1 | 100.5 | 101.7 |
| Jul 23 | 104.2 | 104.5 | 100.5 | 101.7 |
| Jun 23 | 104.1 | 103.9 | 100.3 | 101.5 |
| May 23 | 104.2 | 102.4 | 100.4 | 101.3 |
| Apr 23 | 104.2 | 105.0 | 101.0 | 100.8 |
| Mar 23 | 104.2 | 104.4 | 100.0 | 100.2 |
| Feb 23 | 103.8 | 103.6 | 99.6 | 99.7 |
| Jan 23 | 103.5 | 102.1 | 99.7 | 99.4 |
| Dec 22 | 102.5 | 100.4 | 99.9 | 99.3 |
| Nov 22 | 102.8 | 102.4 | 100.4 | 99.1 |
| Oct 22 | 102.9 | 103.2 | 100.3 | 99.0 |
| Sep 22 | 103.0 | 105.0 | 99.4 | 98.8 |
| Aug 22 | 102.8 | 103.9 | 100.1 | 98.7 |
| Jul 22 | 102.5 | 103.7 | 100.0 | 98.5 |
| Jun 22 | 102.3 | 102.6 | 100.6 | 98.4 |
| May 22 | 101.9 | 102.5 | 100.5 | 98.7 |
| Apr 22 | 101.7 | 102.8 | 100.9 | 99.0 |
| Mar 22 | 101.7 | 100.9 | 101.7 | 100.0 |
| Feb 22 | 101.1 | 101.3 | 101.6 | 100.4 |
| Jan 22 | 100.0 | 100.0 | 100.0 | 100.0 |
Canada's starting position
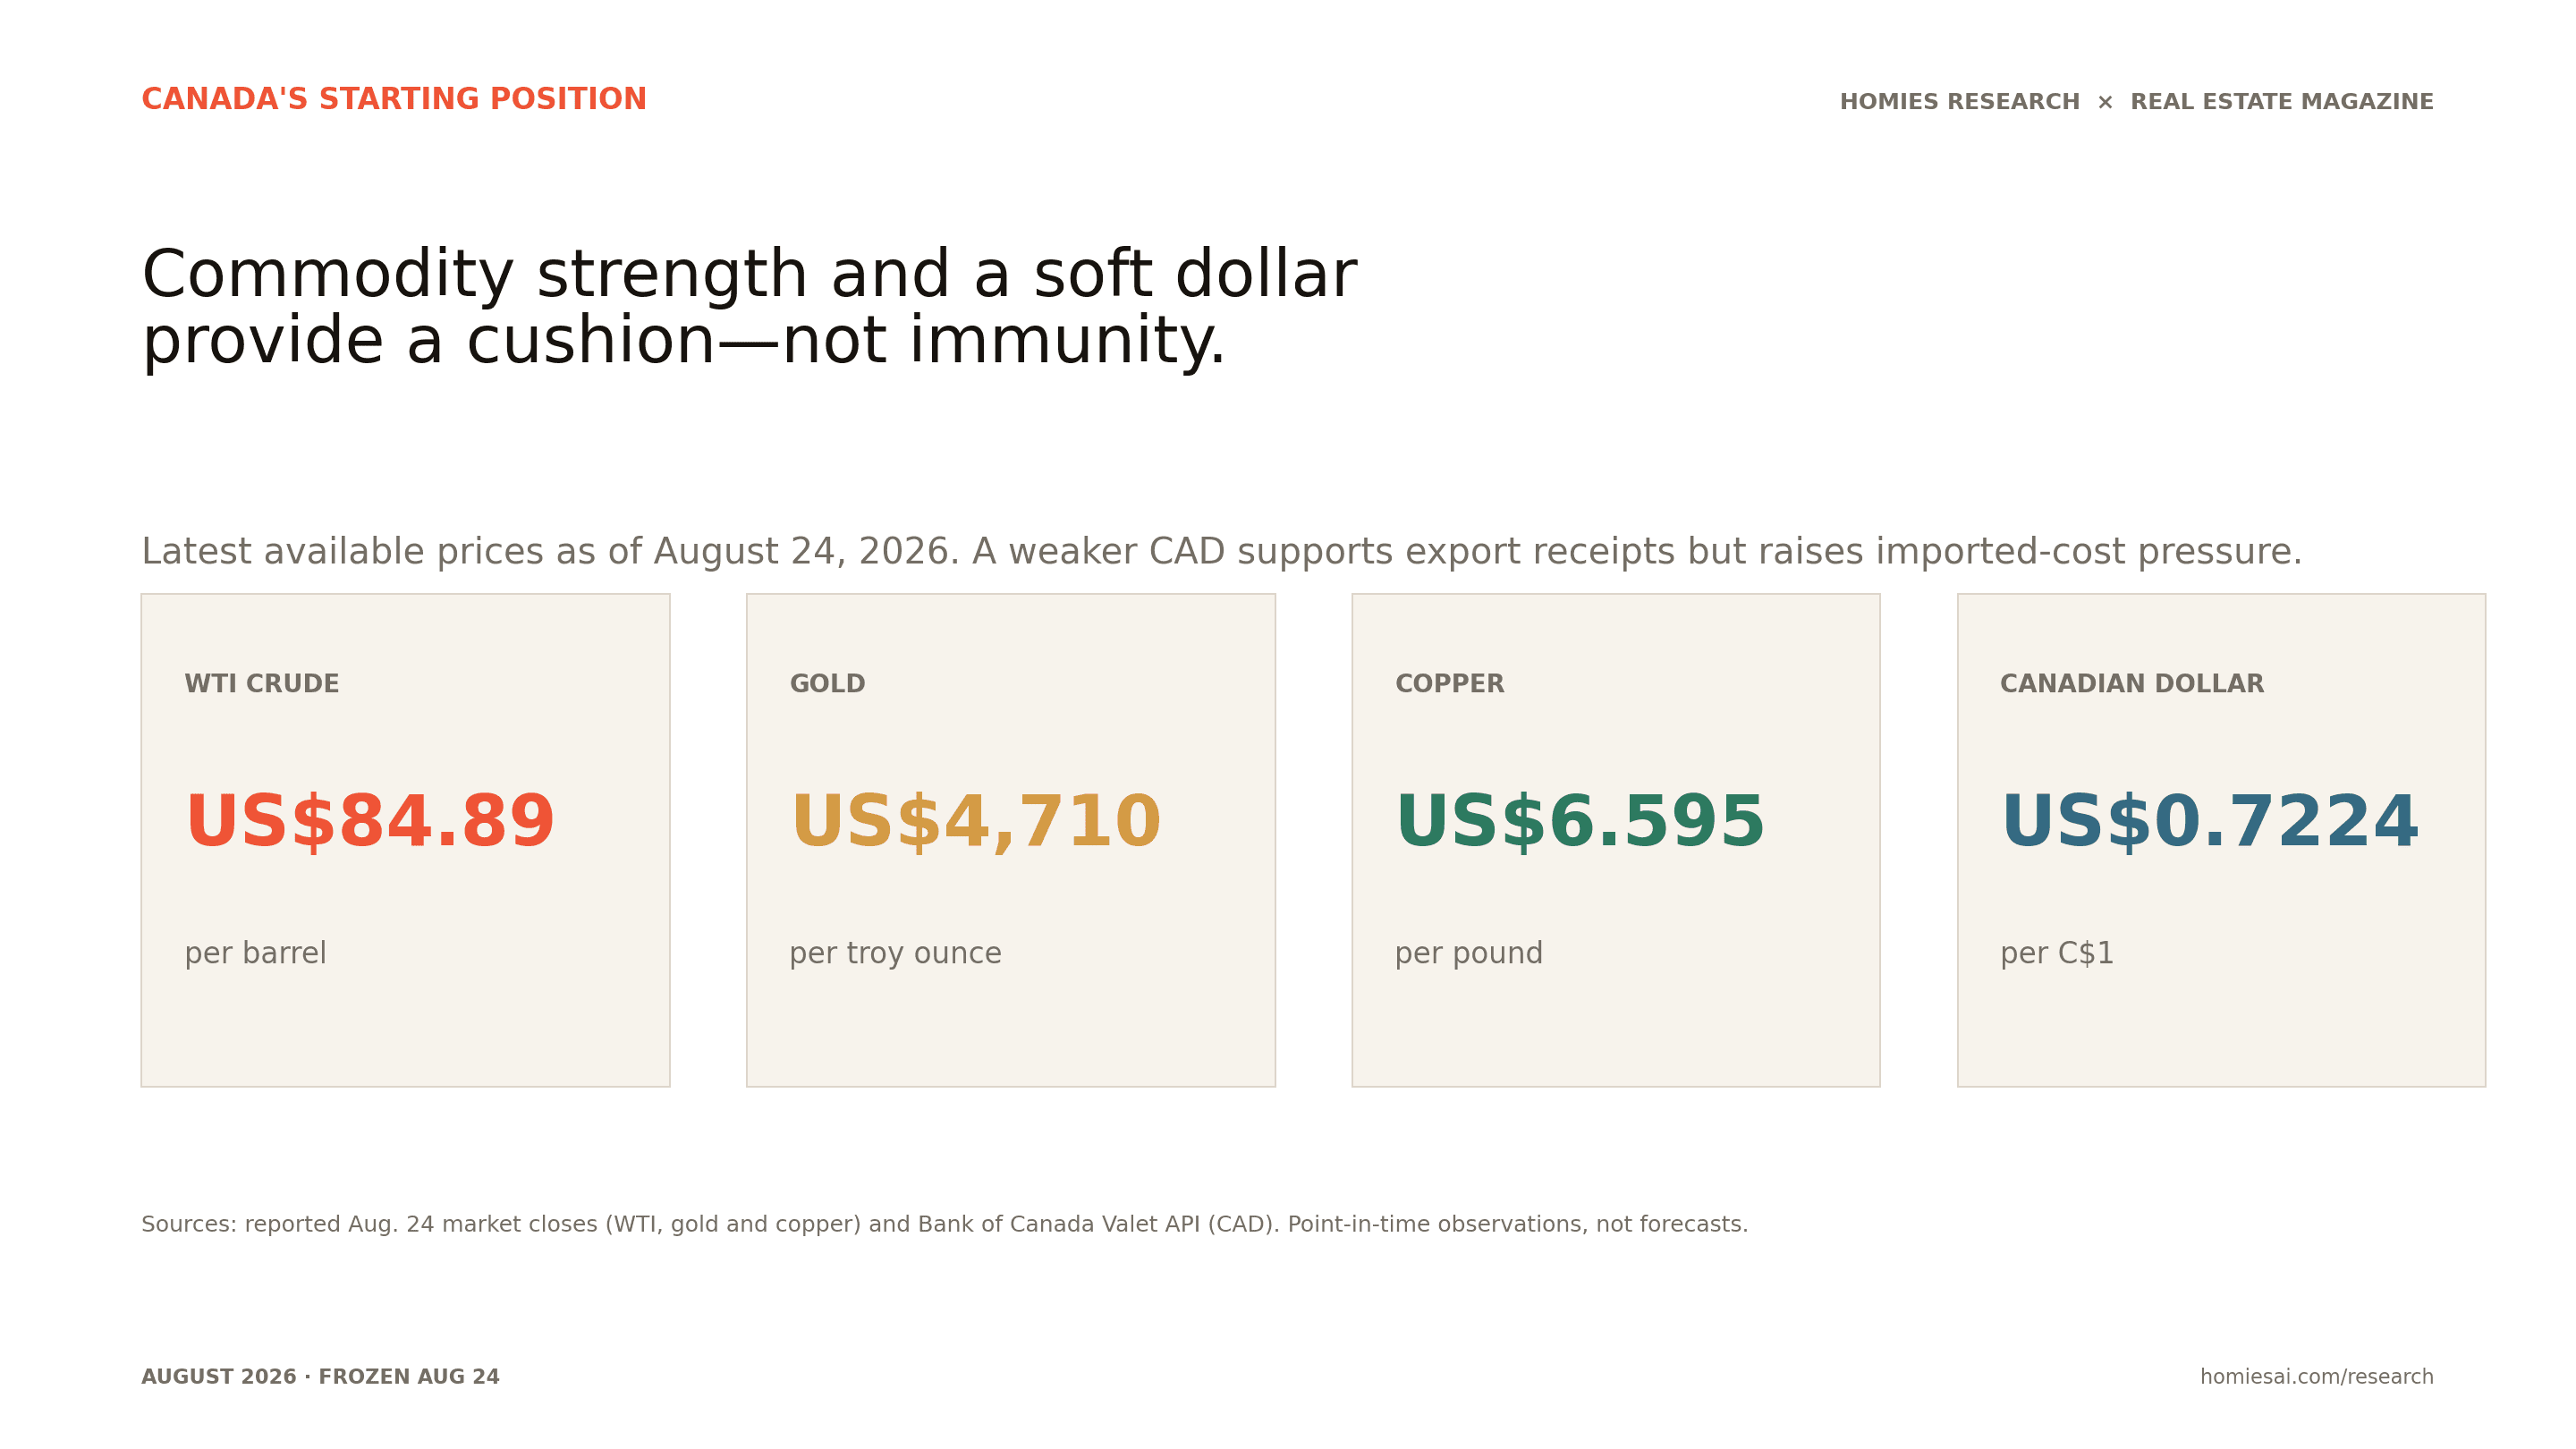
Commodity strength cushions a soft dollar—but does not make Canada immune.
WTI closed at US$84.89, gold at US$4,709.70, copper at US$6.595 per pound and the Canadian dollar at US$0.7224. These are point-in-time readings, not forecasts.
A weaker dollar supports Canadian export receipts but increases the domestic cost of imported goods. That means the same currency move can soften the income hit in commodity regions while adding to inflation pressure for households and businesses.
The inflation risk is moving through product markets, not just crude.
Diesel is the practical bridge between geopolitics and the Canadian price level. It moves freight, construction equipment, agriculture and distribution. When refining margins rise faster than crude, transportation and goods costs can climb even while final demand remains soft.
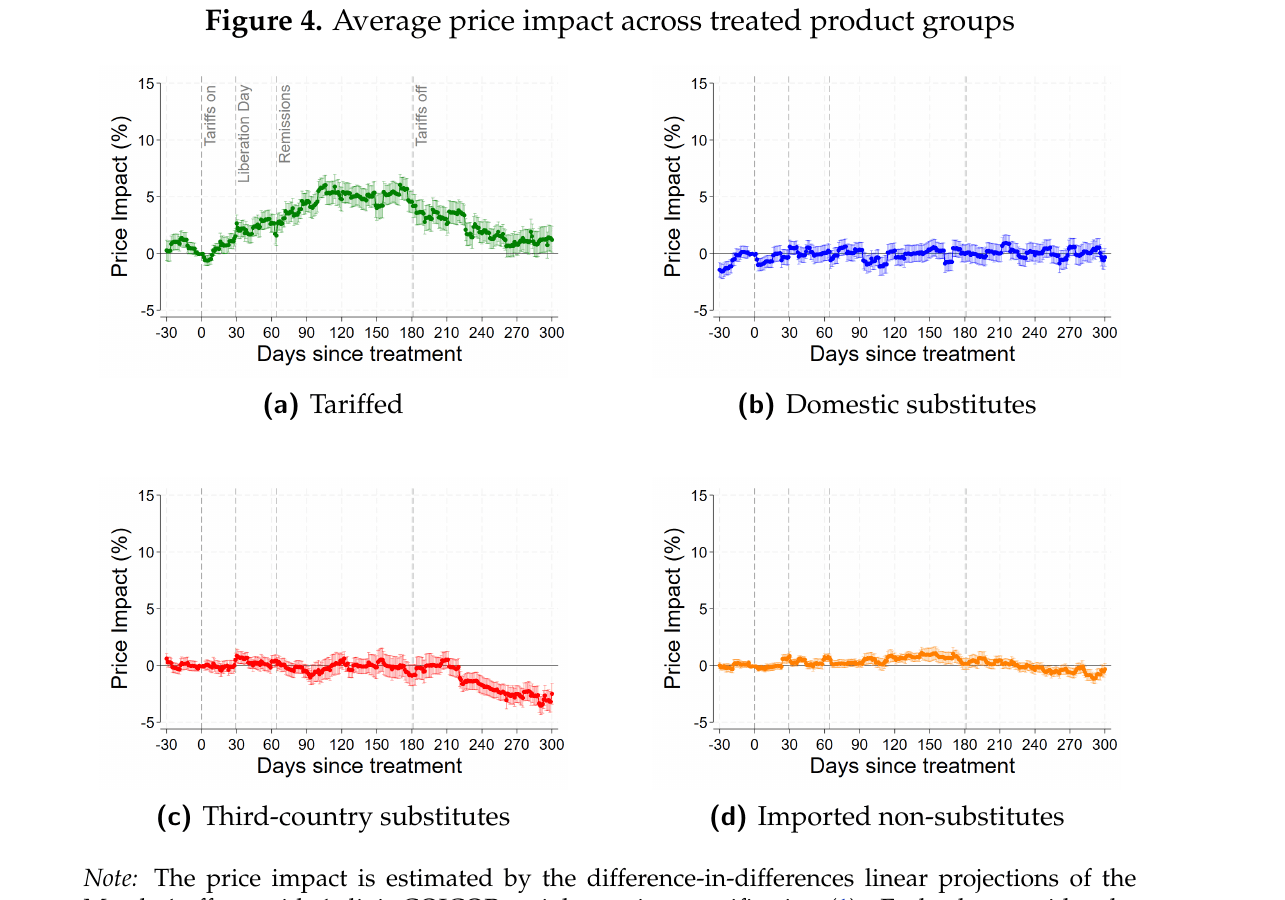
Bank of Canada staff research helps calibrate the tariff channel. In the 2025 Canadian episode studied, prices of tariffed retail products peaked about 6% higher after three months—roughly one-quarter pass-through of a 25% tariff—with little spillover to untariffed domestic substitutes. A separate Bank staff note on the 2018–19 tariffs found materially more pass-through over six quarters. Timing, expectations, sourcing and the duration of the tariff all matter.
Bank of Canada evidence
Tariffed prices rose gradually; substitutes barely moved.
The 2026 staff paper’s four panels separate tariffed products from domestic substitutes, third-country substitutes and imported non-substitutes. The effect concentrated where the tariff actually landed and largely unwound after removal.
This is staff research—not a Governing Council forecast—and it studies a specific episode. It is evidence for gradual, incomplete pass-through, not a universal coefficient for every future tariff.
Diesel margin and reserve explorer
Switch between the derived diesel crack spread and U.S. strategic petroleum reserve stocks. The diesel series is heating oil × 42 minus WTI; the reserve series is directly observed by the EIA.
Monthly last observation derived from EIA heating-oil and WTI spot prices.
Download CSVView accessible data table
| Month | Diesel crack spread, US$/bbl |
|---|---|
| Aug 26 | $97 |
| Jul 26 | $83 |
| Jun 26 | $63 |
| May 26 | $53 |
| Apr 26 | $62 |
| Mar 26 | $68 |
| Feb 26 | $40 |
| Jan 26 | $34 |
| Dec 25 | $27 |
| Nov 25 | $35 |
| Oct 25 | $35 |
| Sep 25 | $31 |
| Aug 25 | $27 |
| Jul 25 | $26 |
| Jun 25 | $28 |
| May 25 | $19 |
| Apr 25 | $21 |
| Mar 25 | $21 |
| Feb 25 | $24 |
| Jan 25 | $27 |
| Dec 24 | $22 |
| Nov 24 | $20 |
| Oct 24 | $20 |
| Sep 24 | $-0 |
| Aug 24 | $13 |
| Jul 24 | $16 |
| Jun 24 | $17 |
| May 24 | $17 |
| Apr 24 | $18 |
| Mar 24 | $22 |
| Feb 24 | $30 |
| Jan 24 | $37 |
| Dec 23 | $31 |
| Nov 23 | $42 |
| Oct 23 | $40 |
| Sep 23 | $45 |
| Aug 23 | $41 |
| Jul 23 | $36 |
| Jun 23 | $27 |
| May 23 | $20 |
| Apr 23 | $16 |
| Mar 23 | $27 |
| Feb 23 | $34 |
| Jan 23 | $47 |
| Dec 22 | $51 |
| Nov 22 | $53 |
| Oct 22 | $94 |
| Sep 22 | $56 |
| Aug 22 | $58 |
| Jul 22 | $46 |
| Jun 22 | $53 |
| May 22 | $50 |
| Apr 22 | $86 |
| Mar 22 | $48 |
| Feb 22 | $24 |
| Jan 22 | $20 |
| Dec 21 | $18 |
| Nov 21 | $15 |
| Oct 21 | $15 |
| Sep 21 | $18 |
| Aug 21 | $14 |
| Jul 21 | $11 |
| Jun 21 | $8 |
| May 21 | $11 |
| Apr 21 | $10 |
| Mar 21 | $9 |
| Feb 21 | $11 |
| Jan 21 | $10 |
| Dec 20 | $10 |
| Nov 20 | $9 |
| Oct 20 | $7 |
| Sep 20 | $6 |
| Aug 20 | $5 |
| Jul 20 | $9 |
| Jun 20 | $8 |
| May 20 | $4 |
| Apr 20 | $11 |
| Mar 20 | $20 |
| Feb 20 | $16 |
| Jan 20 | $15 |
| Dec 19 | $23 |
| Nov 19 | $23 |
| Oct 19 | $25 |
| Sep 19 | $25 |
| Aug 19 | $21 |
| Jul 19 | $22 |
| Jun 19 | $21 |
| May 19 | $22 |
| Apr 19 | $22 |
| Mar 19 | $22 |
| Feb 19 | $26 |
| Jan 19 | $23 |
| Dec 18 | $24 |
| Nov 18 | $26 |
| Oct 18 | $29 |
| Sep 18 | $25 |
| Aug 18 | $23 |
| Jul 18 | $19 |
| Jun 18 | $17 |
| May 18 | $24 |
| Apr 18 | $21 |
| Mar 18 | $18 |
| Feb 18 | $15 |
| Jan 18 | $19 |
| Dec 17 | $23 |
| Nov 17 | $18 |
| Oct 17 | $21 |
| Sep 17 | $24 |
| Aug 17 | $22 |
| Jul 17 | $15 |
| Jun 17 | $12 |
| May 17 | $12 |
| Apr 17 | $11 |
| Mar 17 | $14 |
| Feb 17 | $13 |
| Jan 17 | $11 |
| Dec 16 | $14 |
| Nov 16 | $12 |
| Oct 16 | $12 |
| Sep 16 | $14 |
| Aug 16 | $11 |
| Jul 16 | $8 |
| Jun 16 | $10 |
| May 16 | $10 |
| Apr 16 | $10 |
| Mar 16 | $10 |
| Feb 16 | $10 |
| Jan 16 | $8 |
| Dec 15 | $4 |
| Nov 15 | $11 |
| Oct 15 | $13 |
| Sep 15 | $15 |
| Aug 15 | $15 |
| Jul 15 | $14 |
| Jun 15 | $14 |
| May 15 | $16 |
| Apr 15 | $18 |
| Mar 15 | $18 |
| Feb 15 | $31 |
| Jan 15 | $21 |
| Dec 14 | $19 |
| Nov 14 | $18 |
| Oct 14 | $19 |
| Sep 14 | $16 |
| Aug 14 | $19 |
| Jul 14 | $18 |
| Jun 14 | $14 |
| May 14 | $15 |
| Apr 14 | $20 |
| Mar 14 | $20 |
| Feb 14 | $25 |
| Jan 14 | $39 |
| Dec 13 | $31 |
| Nov 13 | $34 |
| Oct 13 | $27 |
| Sep 13 | $19 |
| Aug 13 | $19 |
| Jul 13 | $17 |
| Jun 13 | $18 |
| May 13 | $19 |
| Apr 13 | $17 |
| Mar 13 | $25 |
| Feb 13 | $33 |
| Jan 13 | $34 |
| Dec 12 | $36 |
| Nov 12 | $39 |
| Oct 12 | $42 |
| Sep 12 | $40 |
| Aug 12 | $37 |
| Jul 12 | $30 |
| Jun 12 | $29 |
| May 12 | $27 |
| Apr 12 | $28 |
| Mar 12 | $30 |
| Feb 12 | $28 |
| Jan 12 | $30 |
| Dec 11 | $24 |
| Nov 11 | $26 |
| Oct 11 | $34 |
| Sep 11 | $38 |
| Aug 11 | $40 |
| Jul 11 | $34 |
| Jun 11 | $28 |
| May 11 | $25 |
| Apr 11 | $24 |
| Mar 11 | $24 |
| Feb 11 | $26 |
| Jan 11 | $23 |
| Dec 10 | $16 |
| Nov 10 | $12 |
| Oct 10 | $11 |
| Sep 10 | $14 |
| Aug 10 | $11 |
| Jul 10 | $7 |
| Jun 10 | $7 |
| May 10 | $10 |
| Apr 10 | $9 |
| Mar 10 | $7 |
| Feb 10 | $5 |
| Jan 10 | $7 |
| Dec 09 | $9 |
| Nov 09 | $6 |
| Oct 09 | $5 |
| Sep 09 | $5 |
| Aug 09 | $4 |
| Jul 09 | $6 |
| Jun 09 | $2 |
| May 09 | $2 |
| Apr 09 | $4 |
| Mar 09 | $6 |
| Feb 09 | $9 |
| Jan 09 | $19 |
| Dec 08 | $11 |
| Nov 08 | $16 |
| Oct 08 | $19 |
| Sep 08 | $19 |
| Aug 08 | $17 |
| Jul 08 | $20 |
| Jun 08 | $23 |
| May 08 | $26 |
| Apr 08 | $20 |
| Mar 08 | $28 |
| Feb 08 | $16 |
| Jan 08 | $14 |
| Dec 07 | $15 |
| Nov 07 | $16 |
| Oct 07 | $11 |
| Sep 07 | $11 |
| Aug 07 | $12 |
| Jul 07 | $10 |
| Jun 07 | $14 |
| May 07 | $15 |
| Apr 07 | $14 |
| Mar 07 | $13 |
| Feb 07 | $13 |
| Jan 07 | $12 |
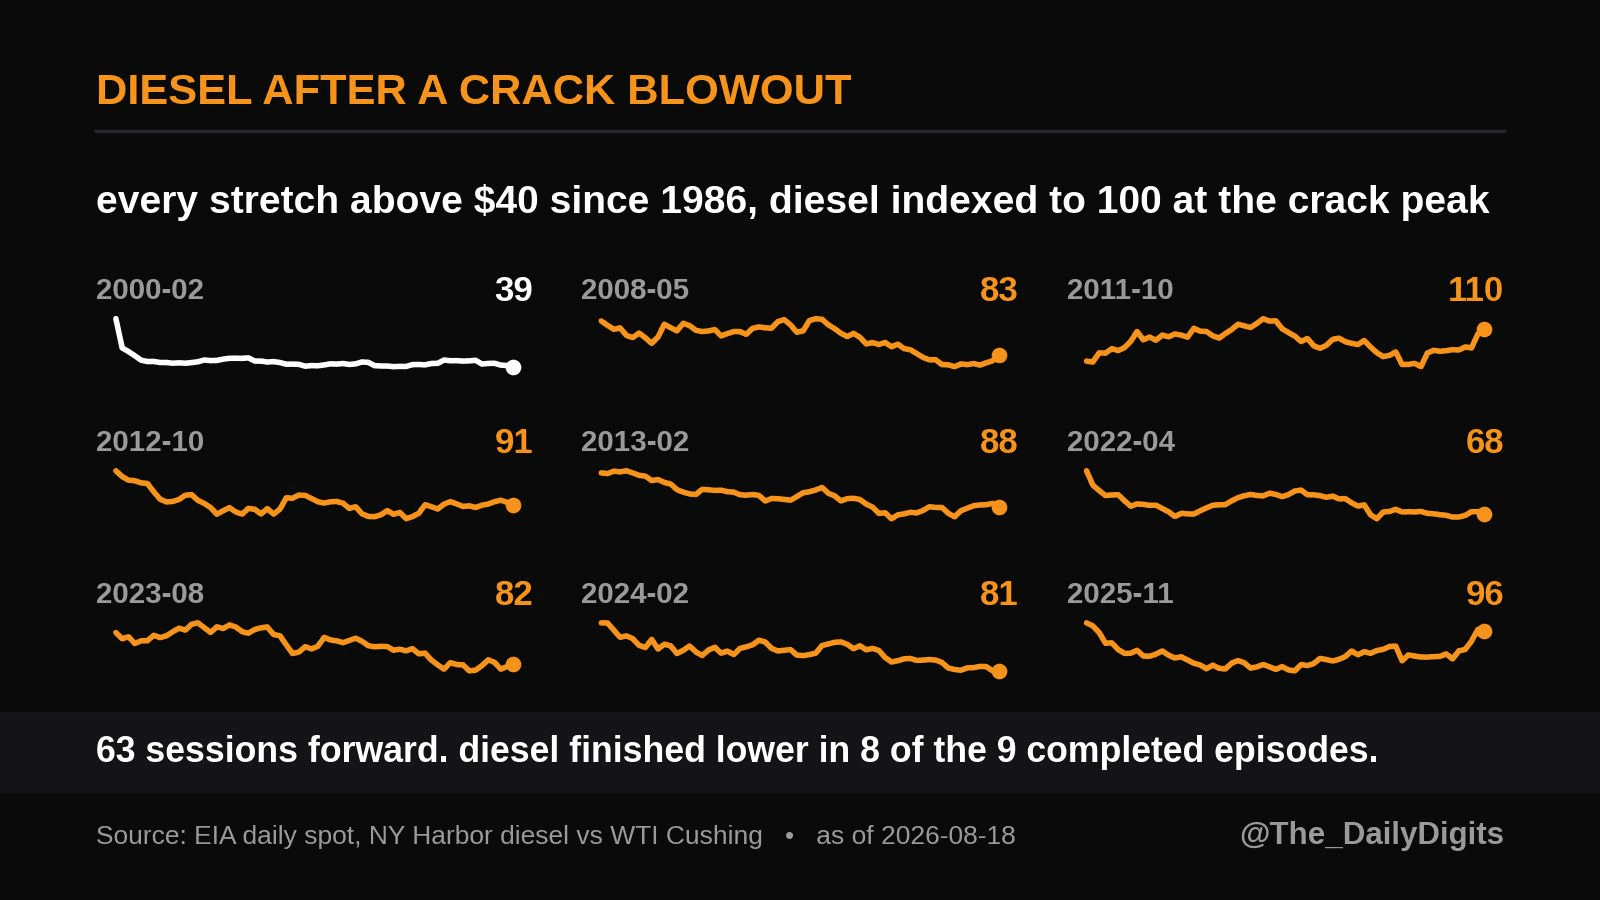
The chart behind the call
Refining constraints can dominate the crude headline.
The original presentation visual shows that refined-product margins can spike in episodes where crude alone does not explain the move. The rebuilt interactive series above lets clients inspect the same mechanism month by month.
Use this as a supply-chain warning light—not a one-variable CPI forecast. Taxes, exchange rates, inventories, refinery outages and demand all affect the retail pass-through.
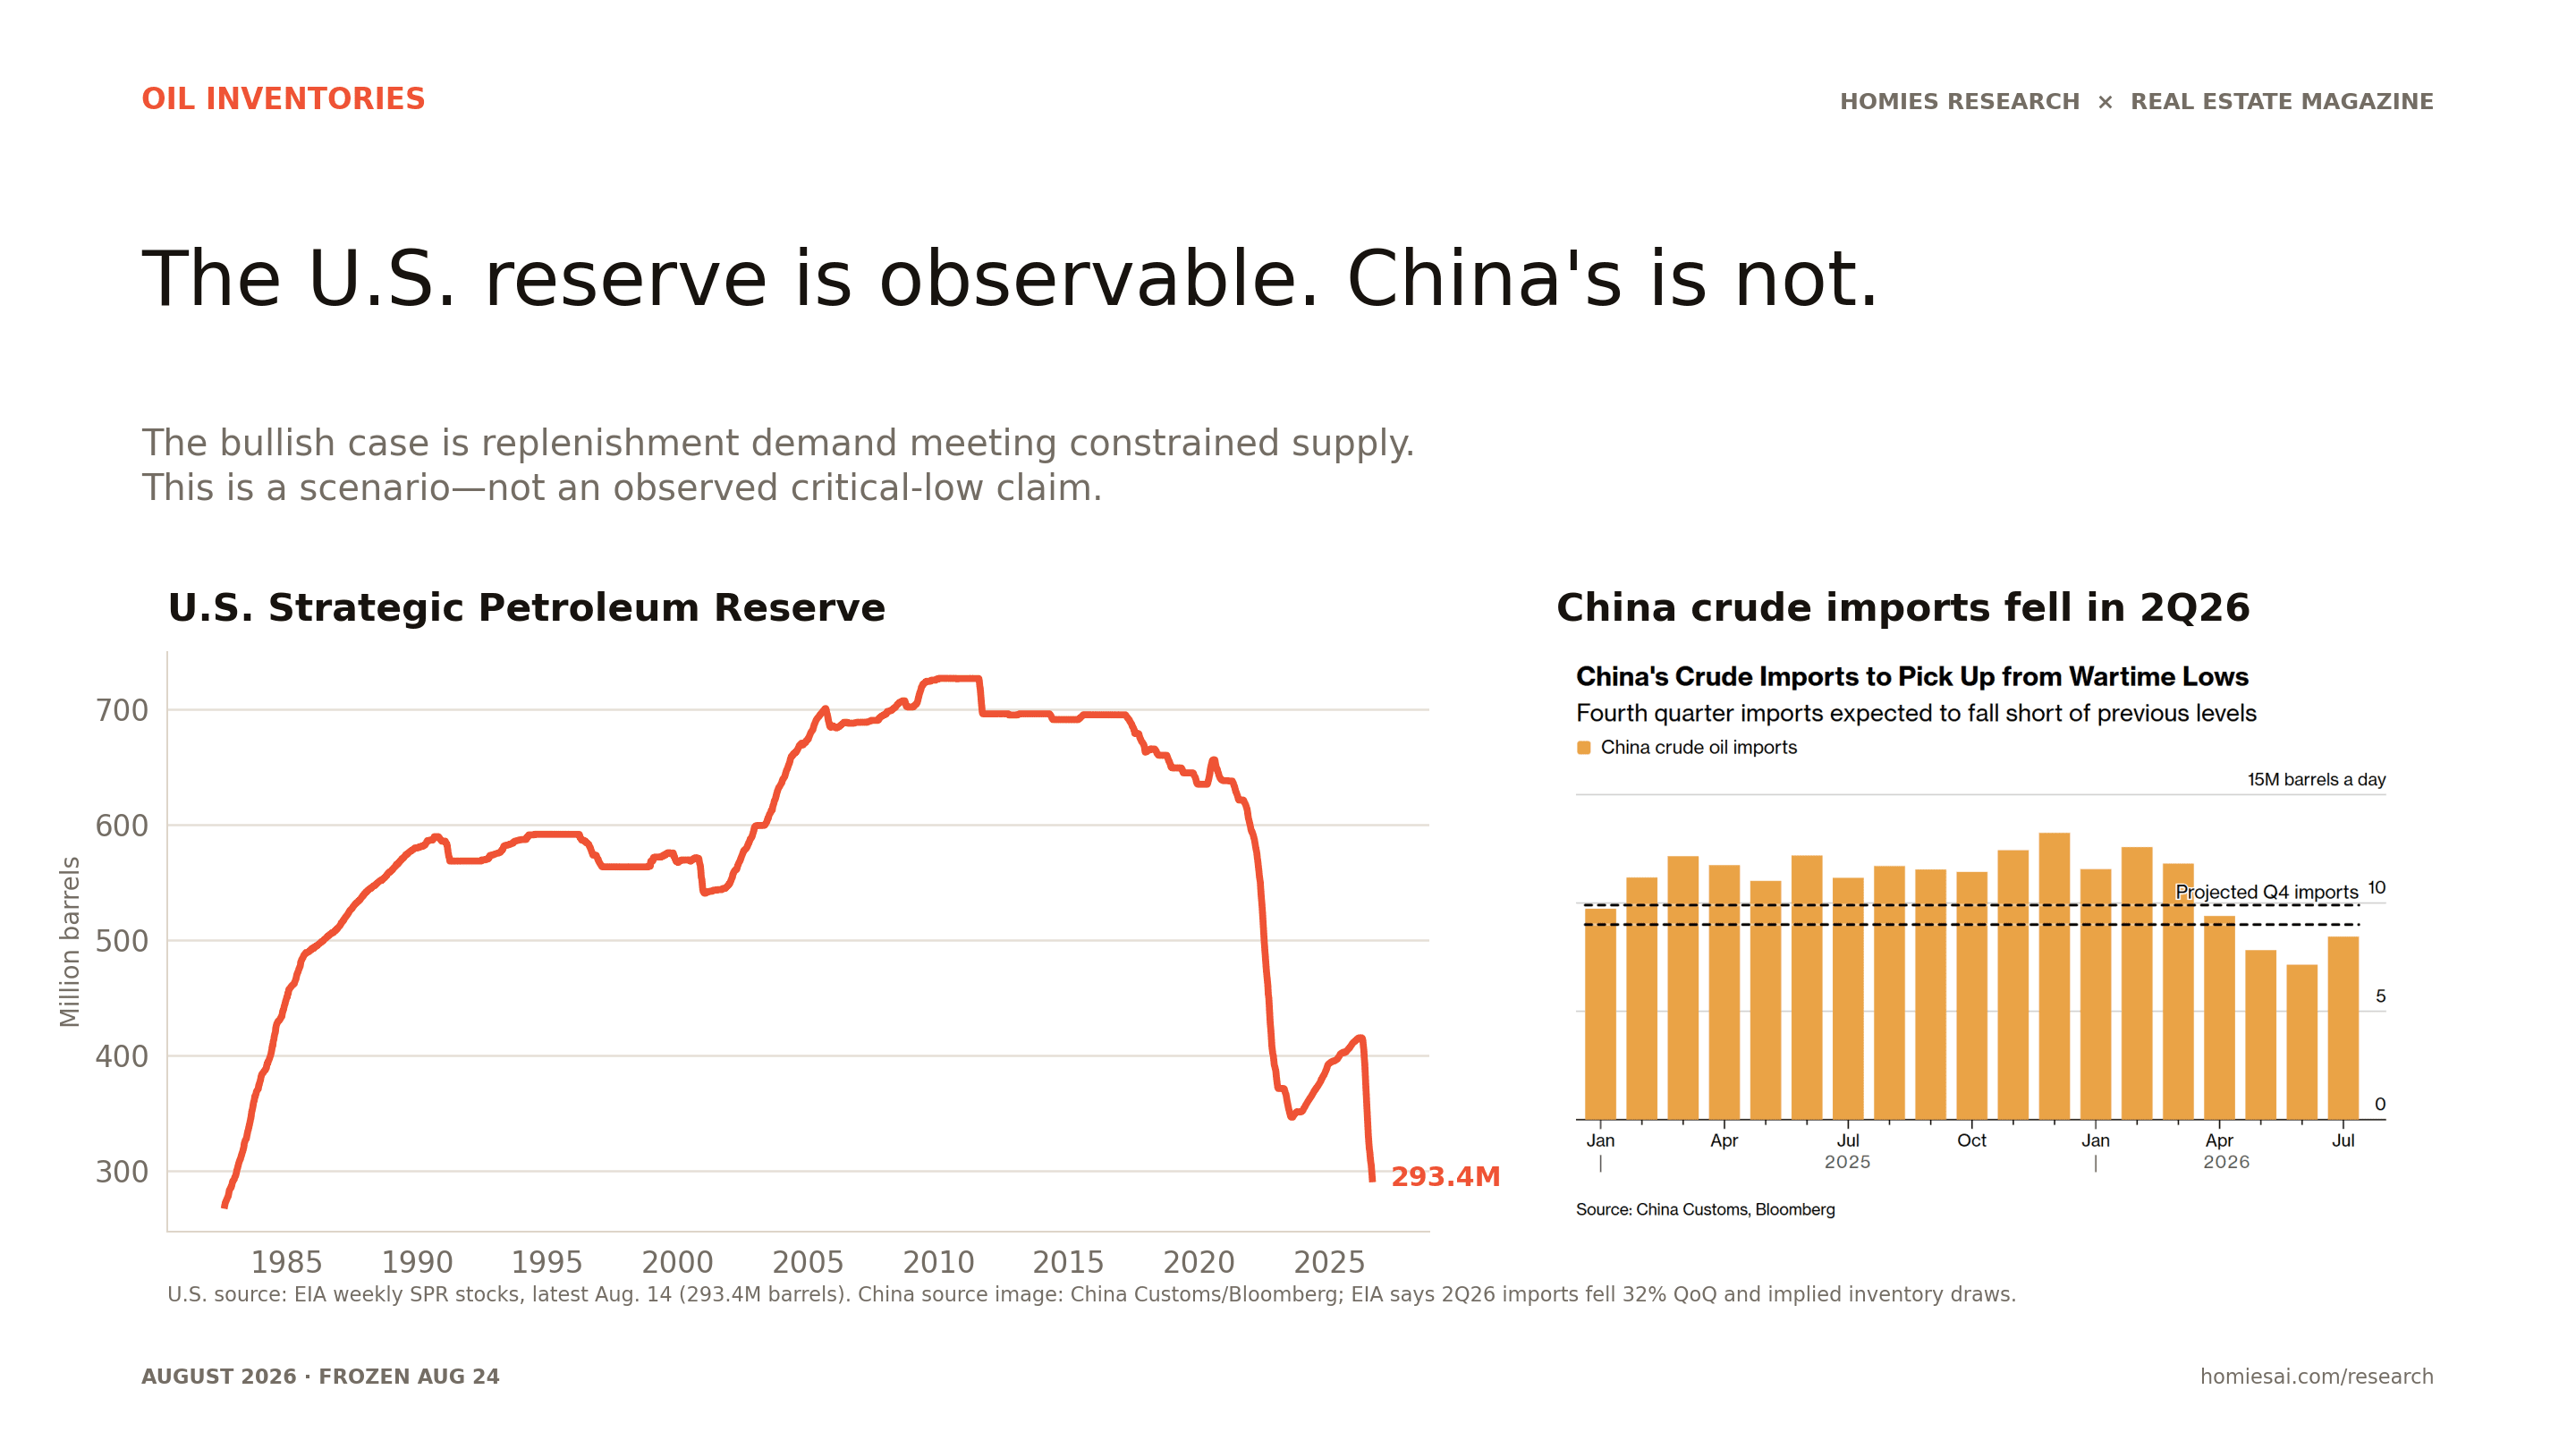
Inventory context
The U.S. reserve is observable. China's strategic stockpile is not.
The U.S. Strategic Petroleum Reserve stood at 293.4 million barrels on August 14, near levels last seen in the early 1980s. China’s crude imports fell to 8.1 million barrels a day in the second quarter, 32% below the prior quarter, and EIA analysis implies inventory draws.
China does not publish a complete, timely strategic-inventory series. Replenishment demand is a plausible bullish scenario—not proof that Chinese reserves have reached a known critical low.
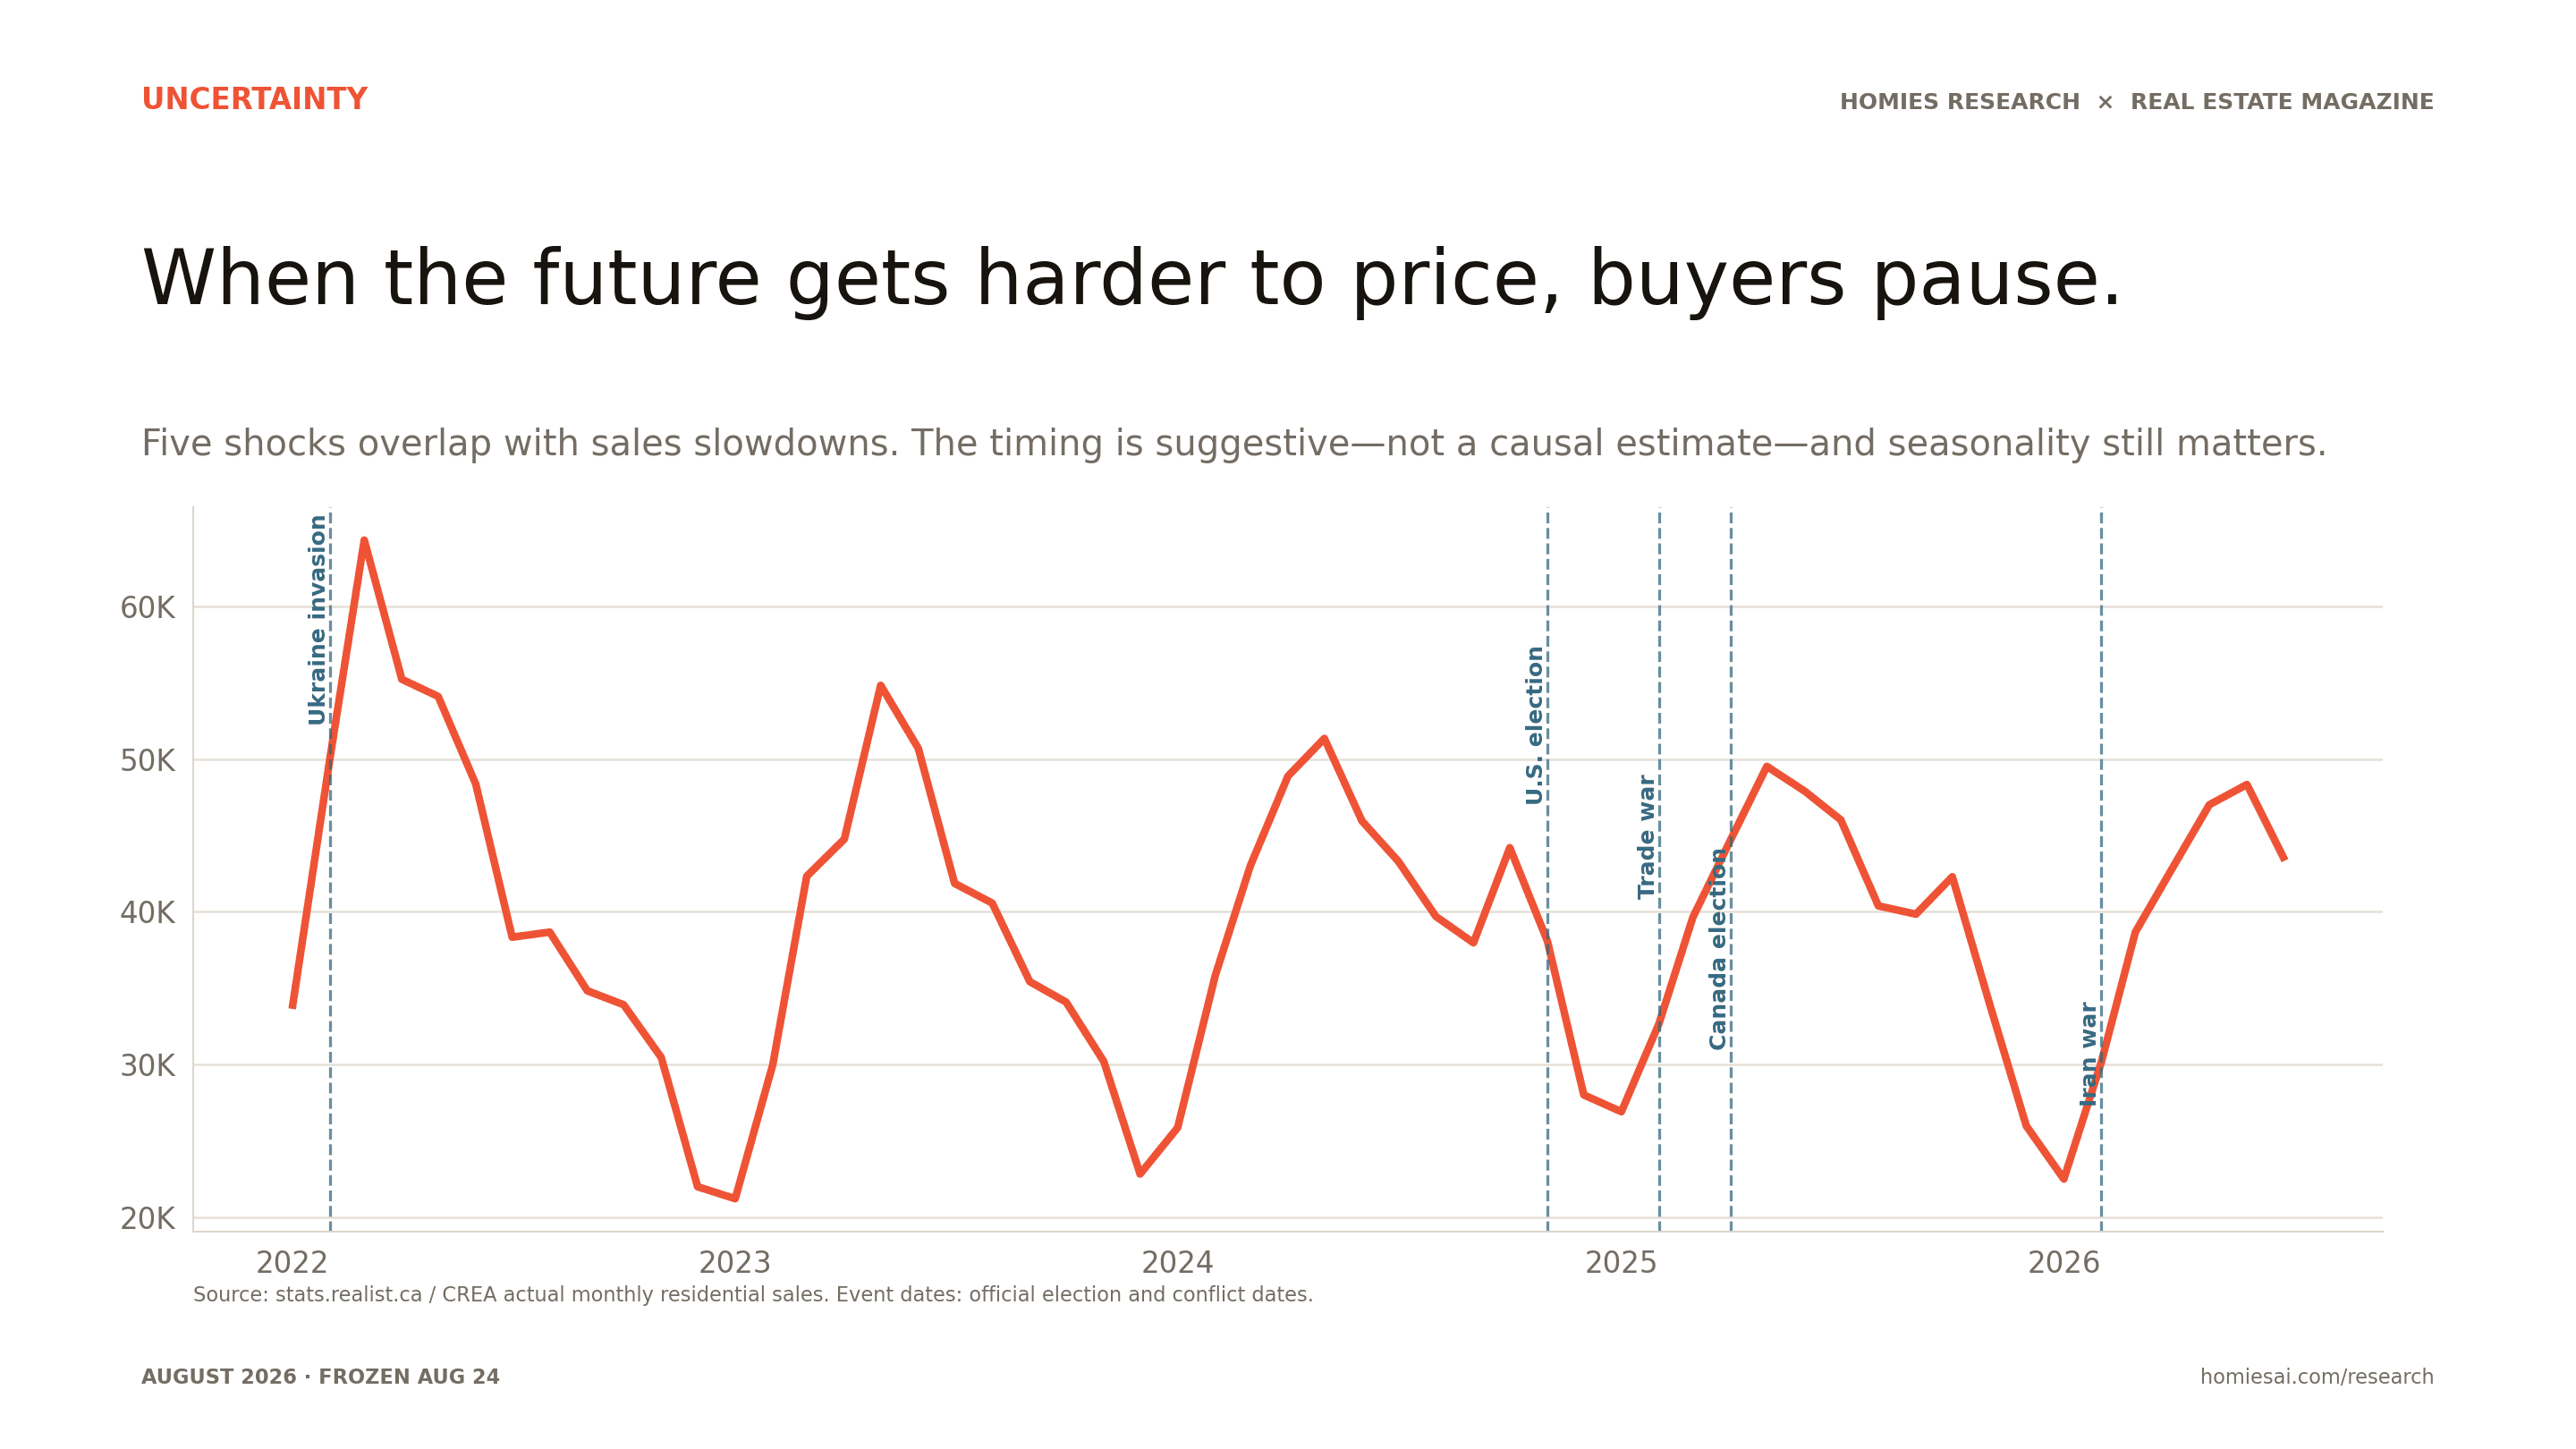
When the future gets harder to price, buyers stop buying.
Housing is a large, irreversible purchase. Elections, war and trade shocks increase the value of waiting because buyers cannot easily price employment, rates, taxes or the resale market. Bank of Canada surveys and Monetary Policy Reports repeatedly describe elevated uncertainty as a reason households postpone major purchases, including homes.
National sales weakened around the Ukraine invasion, the 2024 U.S. election, the opening 2025 tariff shock, the 2025 Canadian election and the 2026 Iran conflict. The overlap is suggestive—not causal. Seasonality, mortgage rates, affordability and local inventory were moving at the same time.
Home sales through five uncertainty shocks
Inspect monthly national sales around the five events highlighted in the presentation. The event timing is context, not a causal estimate.
Actual monthly residential sales. Event timing is contextual and does not establish causation.
Download CSVView accessible data table
| Month | National residential sales |
|---|---|
| Jul 26 | 43,578 |
| Jun 26 | 48,342 |
| May 26 | 47,014 |
| Apr 26 | 42,927 |
| Mar 26 | 38,671 |
| Feb 26 | 30,171 |
| Jan 26 | 22,488 |
| Dec 25 | 25,971 |
| Nov 25 | 33,900 |
| Oct 25 | 42,299 |
| Sep 25 | 39,844 |
| Aug 25 | 40,389 |
| Jul 25 | 46,026 |
| Jun 25 | 47,919 |
| May 25 | 49,529 |
| Apr 25 | 44,698 |
| Mar 25 | 39,645 |
| Feb 25 | 32,669 |
| Jan 25 | 26,898 |
| Dec 24 | 28,002 |
| Nov 24 | 38,080 |
| Oct 24 | 44,201 |
| Sep 24 | 37,968 |
| Aug 24 | 39,696 |
| Jul 24 | 43,309 |
| Jun 24 | 45,956 |
| May 24 | 51,361 |
| Apr 24 | 48,895 |
| Mar 24 | 43,032 |
| Feb 24 | 35,827 |
| Jan 24 | 25,860 |
| Dec 23 | 22,816 |
| Nov 23 | 30,198 |
| Oct 23 | 34,080 |
| Sep 23 | 35,425 |
| Aug 23 | 40,570 |
| Jul 23 | 41,861 |
| Jun 23 | 50,717 |
| May 23 | 54,841 |
| Apr 23 | 44,764 |
| Mar 23 | 42,329 |
| Feb 23 | 29,983 |
| Jan 23 | 21,198 |
| Dec 22 | 21,985 |
| Nov 22 | 30,456 |
| Oct 22 | 33,910 |
| Sep 22 | 34,825 |
| Aug 22 | 38,669 |
| Jul 22 | 38,337 |
| Jun 22 | 48,366 |
| May 22 | 54,112 |
| Apr 22 | 55,239 |
| Mar 22 | 64,360 |
| Feb 22 | 50,207 |
| Jan 22 | 33,890 |
Base case
A soft fall market is still the most defensible scenario.
Improving sales and fewer listings keep the floor intact, but tariff, employment and energy risks make a clean breakout harder. The most likely path is a soft autumn market: regional, inventory-sensitive and vulnerable to confidence shocks.
That view changes if employment rolls over in exposed cities, listings rebuild in Ontario and British Columbia, or product-price inflation forces rates to stay higher for longer.
The H.O.P.E. cycle has likely reached employment.
The H.O.P.E. framework, developed by Michael Kantrowitz at Piper Sandler, describes how an interest-rate shock tends to travel through the economy: Housing, Orders, Profits, then Employment. Housing reacts first because financing costs reprice quickly. Employers react last because hiring and layoffs usually follow changes in demand, output and margins.
Our read is that Canada is at or near that final handoff. Housing weakened early and is now stabilizing; May GDP improved; and the labour market has become the marginal question. July's 75,000 employment gain and lower unemployment rate are early confirmation that the last phase may be turning—but cooler wage growth and a 27,000 decline in public-sector employment argue against declaring victory.
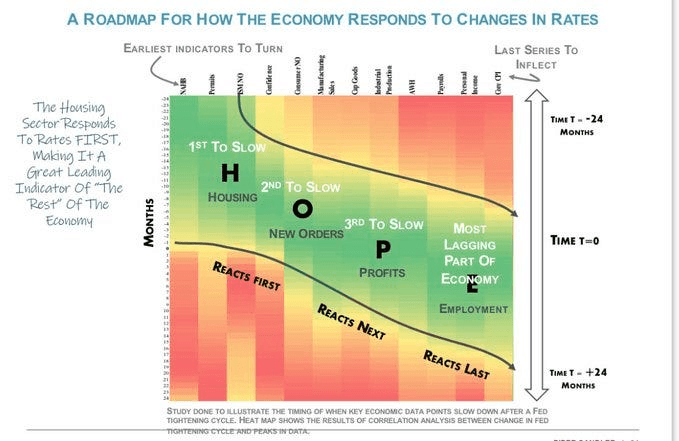
Rate-cycle roadmap
Earlier signals lead; employment confirms last.
Current read: E
- H
Housing
Turned first
Resale activity weakened early in the rate cycle; July sales and the MLS HPI are now edging higher.
- O
Orders
Transmission already visible
Rate-sensitive demand and activity weakened before the labour market became the central question.
- P
Profits
Broad activity improved
May real GDP grew 0.3%, but this edition uses output only as a broad activity proxy—not a profits measure.
- E
Employment
Likely current phase
July employment rose 75,000 and unemployment eased, while wage growth cooled and public employment fell.
H.O.P.E. is a sequencing heuristic, not a fixed calendar or a deterministic recession model. One strong Labour Force Survey print does not confirm a durable turn, and renewed tariff pressure could weaken orders and profits before employment fully heals. Source and attribution: Michael Kantrowitz interview transcript .
Why the trade shock matters now
If employment is the last phase, tariffs arrive at the point where the recovery needs labour income and confidence to validate it. A new orders or margin shock can interrupt the sequence before jobs fully heal. That makes payrolls, hours worked and new listings in tariff-exposed cities the highest-value confirmation data after this call.
Consumer filings are rising—and proposals still carry most of the load.
June consumer insolvencies
Up 11.8% from June 2025; monthly filings are not seasonally adjusted.
Consumer proposals
Up 11.1% year over year and equal to 77.5% of June consumer filings.
Consumer bankruptcies
Up 14.0% year over year—the faster-growing component in June.
Trailing-12-month filings
Consumer insolvencies were 5.9% above the prior 12-month period.
The Office of the Superintendent of Bankruptcy recorded 12,812 consumer insolvency filings in June, including 9,929 proposals and 2,883 bankruptcies. The proposal share matters: the headline is not a count of households abandoning repayment altogether. Most filers are using a formal restructuring process to keep paying a negotiated portion of what they owe.
For housing, this is a pressure gauge—not a forced-listing forecast. Filings lag the underlying shock, the series does not identify homeowners, and it does not tell us whether mortgage debt caused the filing. The practical signal is that household buffers are thinning just as tariffs reopen employment and cost-of-living risks.
Consumer proposals and insolvencies
Explore monthly Canadian filings from 1987 through June 2026. Toggle either series, change the time window, inspect exact months with the pointer or arrow keys, open the table, or download the frozen data.
Counts are monthly and not seasonally adjusted. Consumer insolvencies include proposals and bankruptcies.
Download CSVView accessible data table
| Month | Consumer proposals | Consumer insolvency filings |
|---|---|---|
| Jun 26 | 9,929 | 12,812 |
| May 26 | 9,320 | 12,131 |
| Apr 26 | 9,674 | 12,580 |
| Mar 26 | 10,658 | 13,406 |
| Feb 26 | 9,828 | 12,307 |
| Jan 26 | 9,059 | 11,408 |
| Dec 25 | 8,142 | 10,652 |
| Nov 25 | 9,064 | 11,548 |
| Oct 25 | 9,938 | 12,662 |
| Sep 25 | 9,875 | 12,668 |
| Aug 25 | 8,920 | 11,303 |
| Jul 25 | 9,674 | 12,285 |
| Jun 25 | 8,935 | 11,464 |
| May 25 | 9,373 | 12,004 |
| Apr 25 | 9,006 | 11,646 |
| Mar 25 | 9,593 | 12,126 |
| Feb 25 | 8,673 | 10,903 |
| Jan 25 | 8,975 | 11,196 |
| Dec 24 | 7,288 | 9,292 |
| Nov 24 | 9,228 | 11,725 |
| Oct 24 | 10,025 | 12,723 |
| Sep 24 | 9,107 | 11,452 |
| Aug 24 | 9,021 | 11,388 |
| Jul 24 | 9,213 | 11,748 |
| Jun 24 | 8,751 | 11,096 |
| May 24 | 9,370 | 12,195 |
| Apr 24 | 9,216 | 11,791 |
| Mar 24 | 9,171 | 11,555 |
| Feb 24 | 9,270 | 11,542 |
| Jan 24 | 8,595 | 10,788 |
| Dec 23 | 7,180 | 9,040 |
| Nov 23 | 9,235 | 11,682 |
| Oct 23 | 8,820 | 11,091 |
| Sep 23 | 8,337 | 10,530 |
| Aug 23 | 8,199 | 10,459 |
| Jul 23 | 7,507 | 9,482 |
| Jun 23 | 8,345 | 10,647 |
| May 23 | 8,429 | 10,961 |
| Apr 23 | 7,505 | 9,616 |
| Mar 23 | 9,337 | 11,768 |
| Feb 23 | 7,247 | 9,222 |
| Jan 23 | 6,876 | 8,735 |
| Dec 22 | 5,942 | 7,648 |
| Nov 22 | 7,317 | 9,423 |
| Oct 22 | 6,806 | 8,814 |
| Sep 22 | 6,971 | 9,156 |
| Aug 22 | 6,738 | 8,882 |
| Jul 22 | 5,870 | 7,822 |
| Jun 22 | 6,711 | 8,907 |
| May 22 | 6,240 | 8,425 |
| Apr 22 | 5,825 | 7,954 |
| Mar 22 | 6,854 | 9,195 |
| Feb 22 | 5,526 | 7,392 |
| Jan 22 | 4,798 | 6,566 |
| Dec 21 | 4,802 | 6,745 |
| Nov 21 | 5,725 | 8,102 |
| Oct 21 | 5,247 | 7,419 |
| Sep 21 | 5,263 | 7,497 |
| Aug 21 | 4,875 | 7,012 |
| Jul 21 | 4,651 | 6,604 |
| Jun 21 | 5,127 | 7,448 |
| May 21 | 5,068 | 7,437 |
| Apr 21 | 5,369 | 8,004 |
| Mar 21 | 6,336 | 9,224 |
| Feb 21 | 5,210 | 7,514 |
| Jan 21 | 4,958 | 7,086 |
| Dec 20 | 4,794 | 7,310 |
| Nov 20 | 5,304 | 7,919 |
| Oct 20 | 5,411 | 8,135 |
| Sep 20 | 5,052 | 7,658 |
| Aug 20 | 4,191 | 6,464 |
| Jul 20 | 4,300 | 6,585 |
| Jun 20 | 4,164 | 6,349 |
| May 20 | 4,064 | 6,111 |
| Apr 20 | 4,519 | 6,700 |
| Mar 20 | 7,206 | 10,947 |
| Feb 20 | 7,384 | 11,251 |
| Jan 20 | 7,189 | 11,029 |
| Dec 19 | 6,217 | 10,134 |
| Nov 19 | 7,337 | 11,821 |
| Oct 19 | 8,073 | 13,200 |
| Sep 19 | 7,222 | 11,935 |
| Aug 19 | 6,792 | 11,284 |
| Jul 19 | 6,937 | 11,489 |
| Jun 19 | 6,594 | 10,916 |
| May 19 | 7,212 | 12,375 |
| Apr 19 | 6,922 | 11,785 |
| Mar 19 | 7,318 | 11,963 |
| Feb 19 | 6,204 | 10,303 |
| Jan 19 | 5,941 | 9,973 |
| Dec 18 | 5,087 | 8,939 |
| Nov 18 | 6,670 | 11,320 |
| Oct 18 | 6,558 | 11,641 |
| Sep 18 | 5,528 | 10,005 |
| Aug 18 | 5,844 | 10,479 |
| Jul 18 | 5,392 | 9,829 |
| Jun 18 | 5,795 | 10,474 |
| May 18 | 6,138 | 11,400 |
| Apr 18 | 5,929 | 10,782 |
| Mar 18 | 6,481 | 11,315 |
| Feb 18 | 5,426 | 9,774 |
| Jan 18 | 5,327 | 9,308 |
| Dec 17 | 4,449 | 8,591 |
| Nov 17 | 5,949 | 10,775 |
| Oct 17 | 5,665 | 10,659 |
| Sep 17 | 5,260 | 10,122 |
| Aug 17 | 5,404 | 10,141 |
| Jul 17 | 4,941 | 9,272 |
| Jun 17 | 5,486 | 10,554 |
| May 17 | 5,696 | 11,311 |
| Apr 17 | 5,011 | 10,089 |
| Mar 17 | 6,148 | 11,780 |
| Feb 17 | 5,388 | 9,861 |
| Jan 17 | 4,832 | 9,043 |
| Dec 16 | 4,363 | 8,805 |
| Nov 16 | 5,450 | 10,920 |
| Oct 16 | 5,125 | 10,398 |
| Sep 16 | 5,361 | 10,729 |
| Aug 16 | 5,112 | 10,184 |
| Jul 16 | 4,746 | 9,503 |
| Jun 16 | 5,641 | 11,266 |
| May 16 | 5,504 | 11,437 |
| Apr 16 | 5,483 | 11,560 |
| Mar 16 | 5,824 | 11,625 |
| Feb 16 | 5,408 | 10,657 |
| Jan 16 | 4,489 | 8,794 |
| Dec 15 | 4,464 | 9,500 |
| Nov 15 | 4,935 | 10,059 |
| Oct 15 | 5,158 | 10,593 |
| Sep 15 | 4,847 | 10,262 |
| Aug 15 | 4,350 | 9,221 |
| Jul 15 | 5,038 | 10,338 |
| Jun 15 | 4,874 | 10,463 |
| May 15 | 4,782 | 10,295 |
| Apr 15 | 5,044 | 11,020 |
| Mar 15 | 5,650 | 11,381 |
| Feb 15 | 4,776 | 9,714 |
| Jan 15 | 4,285 | 8,763 |
| Dec 14 | 4,010 | 8,990 |
| Nov 14 | 4,292 | 9,383 |
| Oct 14 | 4,961 | 10,801 |
| Sep 14 | 4,546 | 10,063 |
| Aug 14 | 4,169 | 9,114 |
| Jul 14 | 4,478 | 9,911 |
| Jun 14 | 4,291 | 9,501 |
| May 14 | 4,641 | 10,778 |
| Apr 14 | 4,690 | 10,739 |
| Mar 14 | 4,791 | 10,371 |
| Feb 14 | 4,368 | 9,574 |
| Jan 14 | 3,974 | 8,825 |
| Dec 13 | 3,388 | 8,090 |
| Nov 13 | 4,211 | 9,829 |
| Oct 13 | 4,561 | 10,911 |
| Sep 13 | 4,145 | 9,796 |
| Aug 13 | 3,982 | 9,636 |
| Jul 13 | 3,955 | 9,757 |
| Jun 13 | 3,926 | 9,528 |
| May 13 | 4,611 | 11,187 |
| Apr 13 | 4,523 | 11,157 |
| Mar 13 | 4,365 | 10,161 |
| Feb 13 | 3,905 | 9,279 |
| Jan 13 | 3,882 | 9,347 |
| Dec 12 | 3,075 | 7,674 |
| Nov 12 | 4,169 | 10,232 |
| Oct 12 | 4,299 | 10,754 |
| Sep 12 | 3,517 | 9,055 |
| Aug 12 | 3,853 | 9,746 |
| Jul 12 | 3,624 | 9,249 |
| Jun 12 | 3,927 | 9,907 |
| May 12 | 4,285 | 10,994 |
| Apr 12 | 3,976 | 10,374 |
| Mar 12 | 4,469 | 11,020 |
| Feb 12 | 4,185 | 10,449 |
| Jan 12 | 3,524 | 8,944 |
| Dec 11 | 3,399 | 9,171 |
| Nov 11 | 4,234 | 10,863 |
| Oct 11 | 3,709 | 9,968 |
| Sep 11 | 3,797 | 10,307 |
| Aug 11 | 3,706 | 10,178 |
| Jul 11 | 3,186 | 8,815 |
| Jun 11 | 3,780 | 10,592 |
| May 11 | 3,782 | 10,579 |
| Apr 11 | 3,835 | 10,922 |
| Mar 11 | 4,458 | 12,133 |
| Feb 11 | 3,778 | 10,265 |
| Jan 11 | 3,342 | 9,206 |
| Dec 10 | 3,219 | 9,918 |
| Nov 10 | 4,110 | 12,003 |
| Oct 10 | 3,598 | 11,442 |
| Sep 10 | 3,556 | 11,378 |
| Aug 10 | 3,466 | 10,581 |
| Jul 10 | 3,232 | 10,373 |
| Jun 10 | 3,659 | 11,900 |
| May 10 | 3,205 | 11,123 |
| Apr 10 | 3,802 | 12,435 |
| Mar 10 | 4,012 | 12,796 |
| Feb 10 | 3,435 | 11,041 |
| Jan 10 | 3,020 | 10,018 |
| Dec 09 | 3,020 | 10,764 |
| Nov 09 | 3,629 | 12,111 |
| Oct 09 | 3,640 | 12,456 |
| Sep 09 | 3,160 | 15,465 |
| Aug 09 | 2,494 | 12,033 |
| Jul 09 | 2,797 | 13,091 |
| Jun 09 | 2,969 | 13,792 |
| May 09 | 2,739 | 12,639 |
| Apr 09 | 2,882 | 13,818 |
| Mar 09 | 3,051 | 13,629 |
| Feb 09 | 2,686 | 11,706 |
| Jan 09 | 2,264 | 10,208 |
| Dec 08 | 2,103 | 9,924 |
| Nov 08 | 2,426 | 10,589 |
| Oct 08 | 2,512 | 11,484 |
| Sep 08 | 2,281 | 10,628 |
| Aug 08 | 1,811 | 8,788 |
| Jul 08 | 2,092 | 9,544 |
| Jun 08 | 1,975 | 8,988 |
| May 08 | 2,116 | 9,480 |
| Apr 08 | 2,183 | 10,218 |
| Mar 08 | 1,966 | 8,702 |
| Feb 08 | 1,946 | 9,151 |
| Jan 08 | 1,768 | 8,293 |
| Dec 07 | 1,478 | 6,670 |
| Nov 07 | 1,974 | 9,067 |
| Oct 07 | 1,974 | 9,278 |
| Sep 07 | 1,610 | 8,040 |
| Aug 07 | 1,852 | 8,666 |
| Jul 07 | 1,597 | 7,857 |
| Jun 07 | 1,808 | 8,410 |
| May 07 | 1,889 | 9,365 |
| Apr 07 | 1,795 | 8,588 |
| Mar 07 | 2,066 | 9,243 |
| Feb 07 | 1,754 | 8,185 |
| Jan 07 | 1,649 | 7,924 |
| Dec 06 | 1,445 | 6,840 |
| Nov 06 | 1,769 | 8,715 |
| Oct 06 | 1,772 | 8,719 |
| Sep 06 | 1,658 | 8,227 |
| Aug 06 | 1,640 | 8,264 |
| Jul 06 | 1,454 | 7,162 |
| Jun 06 | 1,590 | 8,383 |
| May 06 | 1,619 | 8,631 |
| Apr 06 | 1,525 | 8,121 |
| Mar 06 | 1,881 | 9,608 |
| Feb 06 | 1,540 | 8,236 |
| Jan 06 | 1,350 | 7,582 |
| Dec 05 | 1,338 | 7,236 |
| Nov 05 | 1,641 | 9,211 |
| Oct 05 | 1,586 | 8,623 |
| Sep 05 | 1,443 | 8,603 |
| Aug 05 | 1,471 | 8,410 |
| Jul 05 | 1,217 | 7,432 |
| Jun 05 | 1,628 | 9,020 |
| May 05 | 1,573 | 9,004 |
| Apr 05 | 1,655 | 9,588 |
| Mar 05 | 1,650 | 9,391 |
| Feb 05 | 1,544 | 8,637 |
| Jan 05 | 1,256 | 7,449 |

Source: stats.realist.ca interactive explorer , using Office of the Superintendent of Bankruptcy / ISED filings. Retrieved August 24, 2026. Consumer insolvencies include consumer bankruptcies and consumer proposals. Counts are filings under the Bankruptcy and Insolvency Act, are not seasonally adjusted, and do not identify tenure, forced listings or the cause of filing.
Unemployment and mortgage arrears
The two national series have moved together over the long run. Indexing both to January 2010 makes the relationship legible without hiding their actual latest rates.
Indexed to January 2010 = 100 for comparability. Correlation is not causation; arrears can lag labour shocks and policy can alter the relationship.
Download CSVView accessible data table
| Month | Unemployment rate index | Mortgage arrears index |
|---|---|---|
| Jul 26 | 76.2 | — |
| Jun 26 | 77.4 | — |
| May 26 | 78.6 | — |
| Apr 26 | 82.1 | — |
| Mar 26 | 79.8 | — |
| Feb 26 | 79.8 | 62.2 |
| Jan 26 | 77.4 | 60.0 |
| Dec 25 | 81.0 | 57.8 |
| Nov 25 | 78.6 | 55.6 |
| Oct 25 | 82.1 | 55.6 |
| Sep 25 | 84.5 | 53.3 |
| Aug 25 | 84.5 | 53.3 |
| Jul 25 | 82.1 | 51.1 |
| Jun 25 | 82.1 | 51.1 |
| May 25 | 83.3 | 48.9 |
| Apr 25 | 82.1 | 48.9 |
| Mar 25 | 81.0 | 48.9 |
| Feb 25 | 78.6 | 51.1 |
| Jan 25 | 79.8 | 48.9 |
| Dec 24 | 79.8 | 48.9 |
| Nov 24 | 83.3 | 46.7 |
| Oct 24 | 78.6 | 46.7 |
| Sep 24 | 77.4 | 44.4 |
| Aug 24 | 78.6 | 44.4 |
| Jul 24 | 76.2 | 44.4 |
| Jun 24 | 76.2 | 42.2 |
| May 24 | 75.0 | 42.2 |
| Apr 24 | 73.8 | 40.0 |
| Mar 24 | 72.6 | 42.2 |
| Feb 24 | 70.2 | 42.2 |
| Jan 24 | 67.9 | 40.0 |
| Dec 23 | 69.0 | 40.0 |
| Nov 23 | 69.0 | 37.8 |
| Oct 23 | 67.9 | 37.8 |
| Sep 23 | 65.5 | 35.6 |
| Aug 23 | 64.3 | 33.3 |
| Jul 23 | 64.3 | 33.3 |
| Jun 23 | 64.3 | 33.3 |
| May 23 | 61.9 | 33.3 |
| Apr 23 | 60.7 | 33.3 |
| Mar 23 | 60.7 | 33.3 |
| Feb 23 | 61.9 | 33.3 |
| Jan 23 | 60.7 | 35.6 |
| Dec 22 | 59.5 | 33.3 |
| Nov 22 | 59.5 | 33.3 |
| Oct 22 | 60.7 | 33.3 |
| Sep 22 | 60.7 | 31.1 |
| Aug 22 | 61.9 | 31.1 |
| Jul 22 | 57.1 | 31.1 |
| Jun 22 | 58.3 | 31.1 |
| May 22 | 61.9 | 33.3 |
| Apr 22 | 64.3 | 33.3 |
| Mar 22 | 64.3 | 33.3 |
| Feb 22 | 65.5 | 35.6 |
| Jan 22 | 76.2 | 37.8 |
| Dec 21 | 70.2 | 37.8 |
| Nov 21 | 72.6 | 37.8 |
| Oct 21 | 77.4 | 37.8 |
| Sep 21 | 83.3 | 40.0 |
| Aug 21 | 84.5 | 40.0 |
| Jul 21 | 88.1 | 40.0 |
| Jun 21 | 94.0 | 42.2 |
| May 21 | 98.8 | 44.4 |
| Apr 21 | 97.6 | 46.7 |
| Mar 21 | 91.7 | 48.9 |
| Feb 21 | 101.2 | 51.1 |
| Jan 21 | 109.5 | 51.1 |
| Dec 20 | 106.0 | 51.1 |
| Nov 20 | 102.4 | 48.9 |
| Oct 20 | 107.1 | 51.1 |
| Sep 20 | 108.3 | 55.6 |
| Aug 20 | 120.2 | 55.6 |
| Jul 20 | 129.8 | 57.8 |
| Jun 20 | 150.0 | 60.0 |
| May 20 | 169.0 | 57.8 |
| Apr 20 | 163.1 | 55.6 |
| Mar 20 | 101.2 | 53.3 |
| Feb 20 | 69.0 | 53.3 |
| Jan 20 | 65.5 | 53.3 |
| Dec 19 | 66.7 | 53.3 |
| Nov 19 | 70.2 | 51.1 |
| Oct 19 | 66.7 | 53.3 |
| Sep 19 | 66.7 | 53.3 |
| Aug 19 | 67.9 | 51.1 |
| Jul 19 | 67.9 | 51.1 |
| Jun 19 | 66.7 | 51.1 |
| May 19 | 65.5 | 51.1 |
| Apr 19 | 67.9 | 51.1 |
| Mar 19 | 69.0 | 53.3 |
| Feb 19 | 69.0 | 53.3 |
| Jan 19 | 67.9 | 55.6 |
| Dec 18 | 66.7 | 53.3 |
| Nov 18 | 67.9 | 53.3 |
| Oct 18 | 66.7 | 53.3 |
| Sep 18 | 69.0 | 53.3 |
| Aug 18 | 71.4 | 51.1 |
| Jul 18 | 70.2 | 53.3 |
| Jun 18 | 71.4 | 51.1 |
| May 18 | 70.2 | 51.1 |
| Apr 18 | 69.0 | 51.1 |
| Mar 18 | 69.0 | 53.3 |
| Feb 18 | 71.4 | 53.3 |
| Jan 18 | 70.2 | 53.3 |
| Dec 17 | 71.4 | 53.3 |
| Nov 17 | 73.8 | 53.3 |
| Oct 17 | 75.0 | 53.3 |
| Sep 17 | 73.8 | 53.3 |
| Aug 17 | 73.8 | 53.3 |
| Jul 17 | 75.0 | 55.6 |
| Jun 17 | 77.4 | 55.6 |
| May 17 | 78.6 | 55.6 |
| Apr 17 | 77.4 | 57.8 |
| Mar 17 | 79.8 | 60.0 |
| Feb 17 | 78.6 | 62.2 |
| Jan 17 | 82.1 | 62.2 |
| Dec 16 | 82.1 | 62.2 |
| Nov 16 | 81.0 | 60.0 |
| Oct 16 | 82.1 | 62.2 |
| Sep 16 | 83.3 | 62.2 |
| Aug 16 | 82.1 | 64.4 |
| Jul 16 | 83.3 | 62.2 |
| Jun 16 | 83.3 | 62.2 |
| May 16 | 84.5 | 62.2 |
| Apr 16 | 86.9 | 62.2 |
| Mar 16 | 85.7 | 62.2 |
| Feb 16 | 86.9 | 62.2 |
| Jan 16 | 85.7 | 62.2 |
| Dec 15 | 86.9 | 60.0 |
| Nov 15 | 84.5 | 57.8 |
| Oct 15 | 83.3 | 60.0 |
| Sep 15 | 84.5 | 60.0 |
| Aug 15 | 84.5 | 60.0 |
| Jul 15 | 83.3 | 60.0 |
| Jun 15 | 82.1 | 60.0 |
| May 15 | 82.1 | 62.2 |
| Apr 15 | 83.3 | 62.2 |
| Mar 15 | 82.1 | 62.2 |
| Feb 15 | 82.1 | 64.4 |
| Jan 15 | 81.0 | 64.4 |
| Dec 14 | 79.8 | 64.4 |
| Nov 14 | 81.0 | 62.2 |
| Oct 14 | 81.0 | 62.2 |
| Sep 14 | 83.3 | 62.2 |
| Aug 14 | 83.3 | 64.4 |
| Jul 14 | 84.5 | 62.2 |
| Jun 14 | 85.7 | 64.4 |
| May 14 | 86.9 | 64.4 |
| Apr 14 | 84.5 | 66.7 |
| Mar 14 | 84.5 | 68.9 |
| Feb 14 | 86.9 | 68.9 |
| Jan 14 | 86.9 | 71.1 |
| Dec 13 | 88.1 | 71.1 |
| Nov 13 | 84.5 | 68.9 |
| Oct 13 | 86.9 | 68.9 |
| Sep 13 | 84.5 | 68.9 |
| Aug 13 | 86.9 | 68.9 |
| Jul 13 | 86.9 | 66.7 |
| Jun 13 | 85.7 | 68.9 |
| May 13 | 84.5 | 68.9 |
| Apr 13 | 85.7 | 68.9 |
| Mar 13 | 86.9 | 71.1 |
| Feb 13 | 84.5 | 73.3 |
| Jan 13 | 84.5 | 73.3 |
| Dec 12 | 86.9 | 73.3 |
| Nov 12 | 88.1 | 71.1 |
| Oct 12 | 88.1 | 71.1 |
| Sep 12 | 88.1 | 73.3 |
| Aug 12 | 88.1 | 73.3 |
| Jul 12 | 86.9 | 73.3 |
| Jun 12 | 88.1 | 73.3 |
| May 12 | 90.5 | 75.6 |
| Apr 12 | 88.1 | 77.8 |
| Mar 12 | 88.1 | 82.2 |
| Feb 12 | 90.5 | 82.2 |
| Jan 12 | 91.7 | 84.4 |
| Dec 11 | 89.3 | 84.4 |
| Nov 11 | 90.5 | 86.7 |
| Oct 11 | 89.3 | 86.7 |
| Sep 11 | 89.3 | 88.9 |
| Aug 11 | 88.1 | 88.9 |
| Jul 11 | 88.1 | 88.9 |
| Jun 11 | 91.7 | 91.1 |
| May 11 | 91.7 | 91.1 |
| Apr 11 | 92.9 | 93.3 |
| Mar 11 | 92.9 | 95.6 |
| Feb 11 | 92.9 | 97.8 |
| Jan 11 | 92.9 | 100.0 |
| Dec 10 | 92.9 | 95.6 |
| Nov 10 | 94.0 | 93.3 |
| Oct 10 | 96.4 | 93.3 |
| Sep 10 | 97.6 | 93.3 |
| Aug 10 | 97.6 | 93.3 |
| Jul 10 | 97.6 | 93.3 |
| Jun 10 | 95.2 | 93.3 |
| May 10 | 97.6 | 93.3 |
| Apr 10 | 97.6 | 95.6 |
| Mar 10 | 98.8 | 97.8 |
| Feb 10 | 100.0 | 100.0 |
| Jan 10 | 100.0 | 100.0 |
Source: stats.realist.ca; Statistics Canada Labour Force Survey and CBA mortgage arrears via Bank of Canada. Unemployment is current through July 2026; arrears through February 2026. Pearson correlation on national monthly levels is descriptive, not causal.
If you are not experimenting with AI, you are probably falling behind.
Grokbot is another signal that AI labs are moving beyond a model in a chatbox toward persistent agents with tools, memory, permissions and a place to work. You do not need a new model religion; you need hands-on experience with the agents arriving inside the harness you already use.
For a Realtor, the important question is whether AI can connect to the actual work: CRM, email, calendar, forms, showing workflows, marketing and browser tools—with human approval where it matters. Experiment there first. If your current stack cannot do it, Homies is a ready-to-use option.
Beta agents
Internal Homies snapshot; not independently audited.
Offers prepared
Across the beta cohort and internal workflows.
Showings handled
Scheduling and calendar actions.
Reported weekly savings
Average from the internal beta survey.
A harness, ready out of the box
Start with Homies for $129.99/month.
Early-access price, regularly $249.99/month, with monthly AI credits included. Try the agent workflows in your existing harness—or use Homies if you want the harness ready out of the box.
Stabilization is visible. A national boom is not.
National home sales rose 0.5% month over month in July, the fourth consecutive seasonally adjusted gain. New listings fell 1.6% for a third consecutive decline. The sales-to-new-listings ratio increased to 51.3%, still below its 54.7% long-run average but no longer signalling the same inventory deterioration.
The MLS Home Price Index increased 0.1% month over month—its first increase since November 2024—while remaining 3.3% below a year earlier. The national average transaction price was $674,819, up 0.2% year over year. Turnover is finding a floor before prices establish a durable uptrend.
National housing pulse
Actual monthly residential series from January 2022 through July 2026. Switch between average price, sales, new listings and market balance.
Monthly series. Hover, touch or use arrow keys to inspect values.
Download CSVView accessible data table
| Month | Unit sales |
|---|---|
| Jul 26 | 43,578 |
| Jun 26 | 48,342 |
| May 26 | 47,014 |
| Apr 26 | 42,927 |
| Mar 26 | 38,671 |
| Feb 26 | 30,171 |
| Jan 26 | 22,488 |
| Dec 25 | 25,971 |
| Nov 25 | 33,900 |
| Oct 25 | 42,299 |
| Sep 25 | 39,844 |
| Aug 25 | 40,389 |
| Jul 25 | 46,026 |
| Jun 25 | 47,919 |
| May 25 | 49,529 |
| Apr 25 | 44,698 |
| Mar 25 | 39,645 |
| Feb 25 | 32,669 |
| Jan 25 | 26,898 |
| Dec 24 | 28,002 |
| Nov 24 | 38,080 |
| Oct 24 | 44,201 |
| Sep 24 | 37,968 |
| Aug 24 | 39,696 |
| Jul 24 | 43,309 |
| Jun 24 | 45,956 |
| May 24 | 51,361 |
| Apr 24 | 48,895 |
| Mar 24 | 43,032 |
| Feb 24 | 35,827 |
| Jan 24 | 25,860 |
| Dec 23 | 22,816 |
| Nov 23 | 30,198 |
| Oct 23 | 34,080 |
| Sep 23 | 35,425 |
| Aug 23 | 40,570 |
| Jul 23 | 41,861 |
| Jun 23 | 50,717 |
| May 23 | 54,841 |
| Apr 23 | 44,764 |
| Mar 23 | 42,329 |
| Feb 23 | 29,983 |
| Jan 23 | 21,198 |
| Dec 22 | 21,985 |
| Nov 22 | 30,456 |
| Oct 22 | 33,910 |
| Sep 22 | 34,825 |
| Aug 22 | 38,669 |
| Jul 22 | 38,337 |
| Jun 22 | 48,366 |
| May 22 | 54,112 |
| Apr 22 | 55,239 |
| Mar 22 | 64,360 |
| Feb 22 | 50,207 |
| Jan 22 | 33,890 |
The provincial split
Atlantic Canada and the Prairies still lead most price rankings. Ontario remains the weakest large province on price, while sales-to-new-listings ratios show a broader improvement in balance.
Latest July 2026 provincial readings from the frozen stats.realist.ca / CREA snapshot.
Download CSVView accessible data table
| Province | Average price, YoY |
|---|---|
| Prince Edward Island | +5.6% |
| Saskatchewan | +5.5% |
| Quebec | +5.2% |
| Newfoundland & Labrador | +3.0% |
| Alberta | +2.7% |
| New Brunswick | +2.2% |
| Manitoba | +2.2% |
| Nova Scotia | +1.5% |
| British Columbia | -1.3% |
| Ontario | -2.9% |
Five large-market paths
Toronto and Greater Vancouver still carry the softest price and balance readings. Calgary and Edmonton retain stronger price levels, but July sales were below a year earlier in every market except Ottawa.
Monthly series. Hover, touch or use arrow keys to inspect values.
Download CSVView accessible data table
| Month | Toronto | Greater Vancouver | Calgary | Edmonton | Ottawa |
|---|---|---|---|---|---|
| Jul 26 | 80.6 | 94.7 | 122.3 | 121.9 | 98.7 |
| Jun 26 | 85.0 | 97.3 | 129.6 | 125.2 | 106.7 |
| May 26 | 85.9 | 96.4 | 129.8 | 125.9 | 104.5 |
| Apr 26 | 84.4 | 94.9 | 127.5 | 124.1 | 102.8 |
| Mar 26 | 81.7 | 93.4 | 124.7 | 122.0 | 100.1 |
| Feb 26 | 80.9 | 94.1 | 120.5 | 118.4 | 94.8 |
| Jan 26 | 77.9 | 94.4 | 118.8 | 117.1 | 91.2 |
| Dec 25 | 80.8 | 92.9 | 121.3 | 117.6 | 93.4 |
| Nov 25 | 83.5 | 96.7 | 120.6 | 114.8 | 98.0 |
| Oct 25 | 84.5 | 98.5 | 124.9 | 116.9 | 102.4 |
| Sep 25 | 85.1 | 97.7 | 118.8 | 116.1 | 99.9 |
| Aug 25 | 82.0 | 95.7 | 117.9 | 118.6 | 99.0 |
| Jul 25 | 84.4 | 96.6 | 119.9 | 119.4 | 100.3 |
| Jun 25 | 88.5 | 99.3 | 126.3 | 119.5 | 104.8 |
| May 25 | 90.0 | 98.6 | 126.7 | 119.4 | 105.8 |
| Apr 25 | 88.8 | 94.6 | 126.2 | 120.8 | 101.8 |
| Mar 25 | 87.5 | 96.4 | 124.4 | 119.3 | 98.5 |
| Feb 25 | 87.2 | 95.5 | 119.1 | 115.4 | 96.8 |
| Jan 25 | 83.6 | 94.0 | 118.7 | 113.0 | 96.2 |
| Dec 24 | 85.1 | 99.7 | 117.1 | 112.1 | 94.3 |
| Nov 24 | 89.1 | 99.6 | 120.0 | 112.0 | 96.7 |
| Oct 24 | 91.2 | 97.3 | 120.0 | 113.3 | 97.0 |
| Sep 24 | 89.3 | 97.9 | 120.2 | 112.9 | 99.4 |
| Aug 24 | 86.5 | 97.7 | 118.3 | 111.5 | 96.7 |
| Jul 24 | 89.4 | 100.5 | 118.5 | 113.3 | 98.5 |
| Jun 24 | 93.5 | 105.1 | 121.7 | 113.0 | 99.1 |
| May 24 | 93.7 | 104.7 | 120.5 | 113.6 | 100.7 |
| Apr 24 | 92.7 | 101.5 | 118.8 | 111.4 | 101.6 |
| Mar 24 | 90.4 | 102.5 | 117.7 | 108.4 | 99.2 |
| Feb 24 | 89.5 | 99.6 | 113.0 | 105.0 | 95.4 |
| Jan 24 | 82.6 | 97.6 | 110.7 | 103.2 | 91.7 |
| Dec 23 | 87.3 | 96.6 | 105.7 | 99.3 | 92.4 |
| Nov 23 | 87.5 | 100.2 | 105.5 | 98.1 | 92.6 |
| Oct 23 | 90.5 | 101.5 | 105.5 | 100.9 | 96.0 |
| Sep 23 | 90.7 | 101.6 | 105.4 | 101.3 | 98.7 |
| Aug 23 | 87.4 | 99.8 | 101.4 | 101.1 | 95.7 |
| Jul 23 | 90.4 | 99.2 | 104.8 | 104.3 | 101.1 |
| Jun 23 | 95.2 | 98.7 | 108.0 | 105.8 | 99.3 |
| May 23 | 96.2 | 102.2 | 107.1 | 107.6 | 98.8 |
| Apr 23 | 92.7 | 100.9 | 106.1 | 104.8 | 101.3 |
| Mar 23 | 89.1 | 98.9 | 103.2 | 99.5 | 93.8 |
| Feb 23 | 88.2 | 95.1 | 99.1 | 94.6 | 92.5 |
| Jan 23 | 83.5 | 90.9 | 99.1 | 93.8 | 89.7 |
| Dec 22 | 84.7 | 91.9 | 98.0 | 95.4 | 89.2 |
| Nov 22 | 87.3 | 93.7 | 95.2 | 96.8 | 92.3 |
| Oct 22 | 87.4 | 96.7 | 98.2 | 101.6 | 92.9 |
| Sep 22 | 87.6 | 96.1 | 96.4 | 100.2 | 94.6 |
| Aug 22 | 87.9 | 92.5 | 95.4 | 100.5 | 93.1 |
| Jul 22 | 86.3 | 94.1 | 97.6 | 106.0 | 96.9 |
| Jun 22 | 92.2 | 94.9 | 101.0 | 108.4 | 101.5 |
| May 22 | 97.5 | 99.3 | 101.7 | 109.0 | 106.3 |
| Apr 22 | 100.5 | 104.6 | 103.4 | 111.3 | 109.0 |
| Mar 22 | 104.6 | 104.5 | 104.3 | 110.7 | 111.7 |
| Feb 22 | 107.5 | 104.9 | 107.5 | 109.3 | 110.6 |
| Jan 22 | 100.0 | 100.0 | 100.0 | 100.0 | 100.0 |
Index begins at 100 for each market’s January 2022 observation.
| Market | Avg. price | Price YoY | Sales YoY | Listings YoY | SNLR |
|---|---|---|---|---|---|
| Toronto | $1,003,956 | -4.5% | -0.9% | -17.8% | 41.4% |
| Greater Vancouver | $1,216,914 | -1.9% | -9.6% | -14.1% | 42.5% |
| Calgary | $642,837 | +2.0% | -6.7% | -10.9% | 57.6% |
| Edmonton | $465,177 | +2.1% | -11.0% | -2.1% | 58.2% |
| Ottawa | $694,698 | -1.6% | +1.1% | -3.0% | 52.4% |
The five-city comparison uses the largest current board-level series exposed in the stats.realist.ca public manifest: Toronto, Greater Vancouver, Calgary, Edmonton and Ottawa. A Greater Montréal board aggregate was not available in that manifest; Quebec is shown in the provincial view.
What changes on Tuesday morning?
Tariff-exposed markets
Lead with employment and sector exposure, not a generic national forecast. Add employer and industry questions to every seller and buyer intake.
Ontario and Vancouver
More balance does not mean pricing power has returned. Use current competing inventory and absorption; do not anchor to 2022 or even early-2025 expectations.
Prairies and Atlantic Canada
Stronger price momentum can coexist with slower sales. Watch whether listings rebuild before assuming another leg of appreciation.
Your own operating system
Start experimenting inside the harness you already use. If it cannot connect CRM, calendar, marketing and transaction work with human approvals, try Homies.
Housing found a floor at the same moment trade risk reopened the trapdoor.
The bullish confirmation would be continued sales gains, rising prices without a renewed listing surge, and stable employment through the tariff shock. The bearish confirmation would be a local employment rollover in exposed cities, a renewed inventory build in Ontario and British Columbia, or gasoline and import costs broadening into persistent core inflation.
Sources and methodology
The report freezes information available through August 24, 2026. Housing, macro, consumer-insolvency and mortgage-arrears charts use a frozen copy of public stats.realist.ca series; national release statistics are reconciled to Statistics Canada, CREA, OSB/ISED, EIA and Bank of Canada sources. Tariff exposure visuals from Business Data Lab and Oxford Economics use different methodologies. Event overlays and correlations are descriptive, not causal. Homies operating metrics are internal beta counts and survey results, not independently audited.
- Prime Minister — tariff statement
- First Ministers — retaliation timing
- Business Data Lab — city exposure
- Oxford Economics — metro exposure
- Statistics Canada — July CPI
- Statistics Canada — July LFS
- Statistics Canada — May GDP
- Bank of Canada — 2026 tariff pass-through
- Bank of Canada — July 2026 MPR
- EIA — diesel and refined-product pricing
- EIA — Strategic Petroleum Reserve
- EIA — China crude imports
- Michael Kantrowitz — H.O.P.E. framework
- CREA — July housing release
- stats.realist.ca — public explorer
- stats.realist.ca — consumer insolvencies
- OSB / ISED — Q2 insolvencies