Make it yours · Copy & paste
Your jobs report. Your brand.
Copy this into Homies or your AI. It uses the verified September release, picks up your saved brand, and asks for any missing context one question at a time.
Make me a branded September jobs report I can send to my database.
Canada jobs report · September 2026
A small rate change.A bigger jobs story.
Canada lost 68,300 jobs in September. Public sector employment fell sharply, youth bore most of the net decline, and Alberta moved against the national trend.
−68,300
net employment change from August
People employed
21.105m
−0.3% monthly · +0.5% yearly
Exact table estimate: 21,104,800
Unemployment rate
6.5%
+0.1 pp monthly · −0.6 pp yearly
6.4% in August
Employment rate
60.6%
−0.2 pp monthly · flat yearly
Share of the population aged 15+
Labour force participation
64.8%
−0.2 pp monthly · −0.4 pp yearly
Employed or looking for work
Class of worker
Public employment is shrinking. Private employment is holding up.
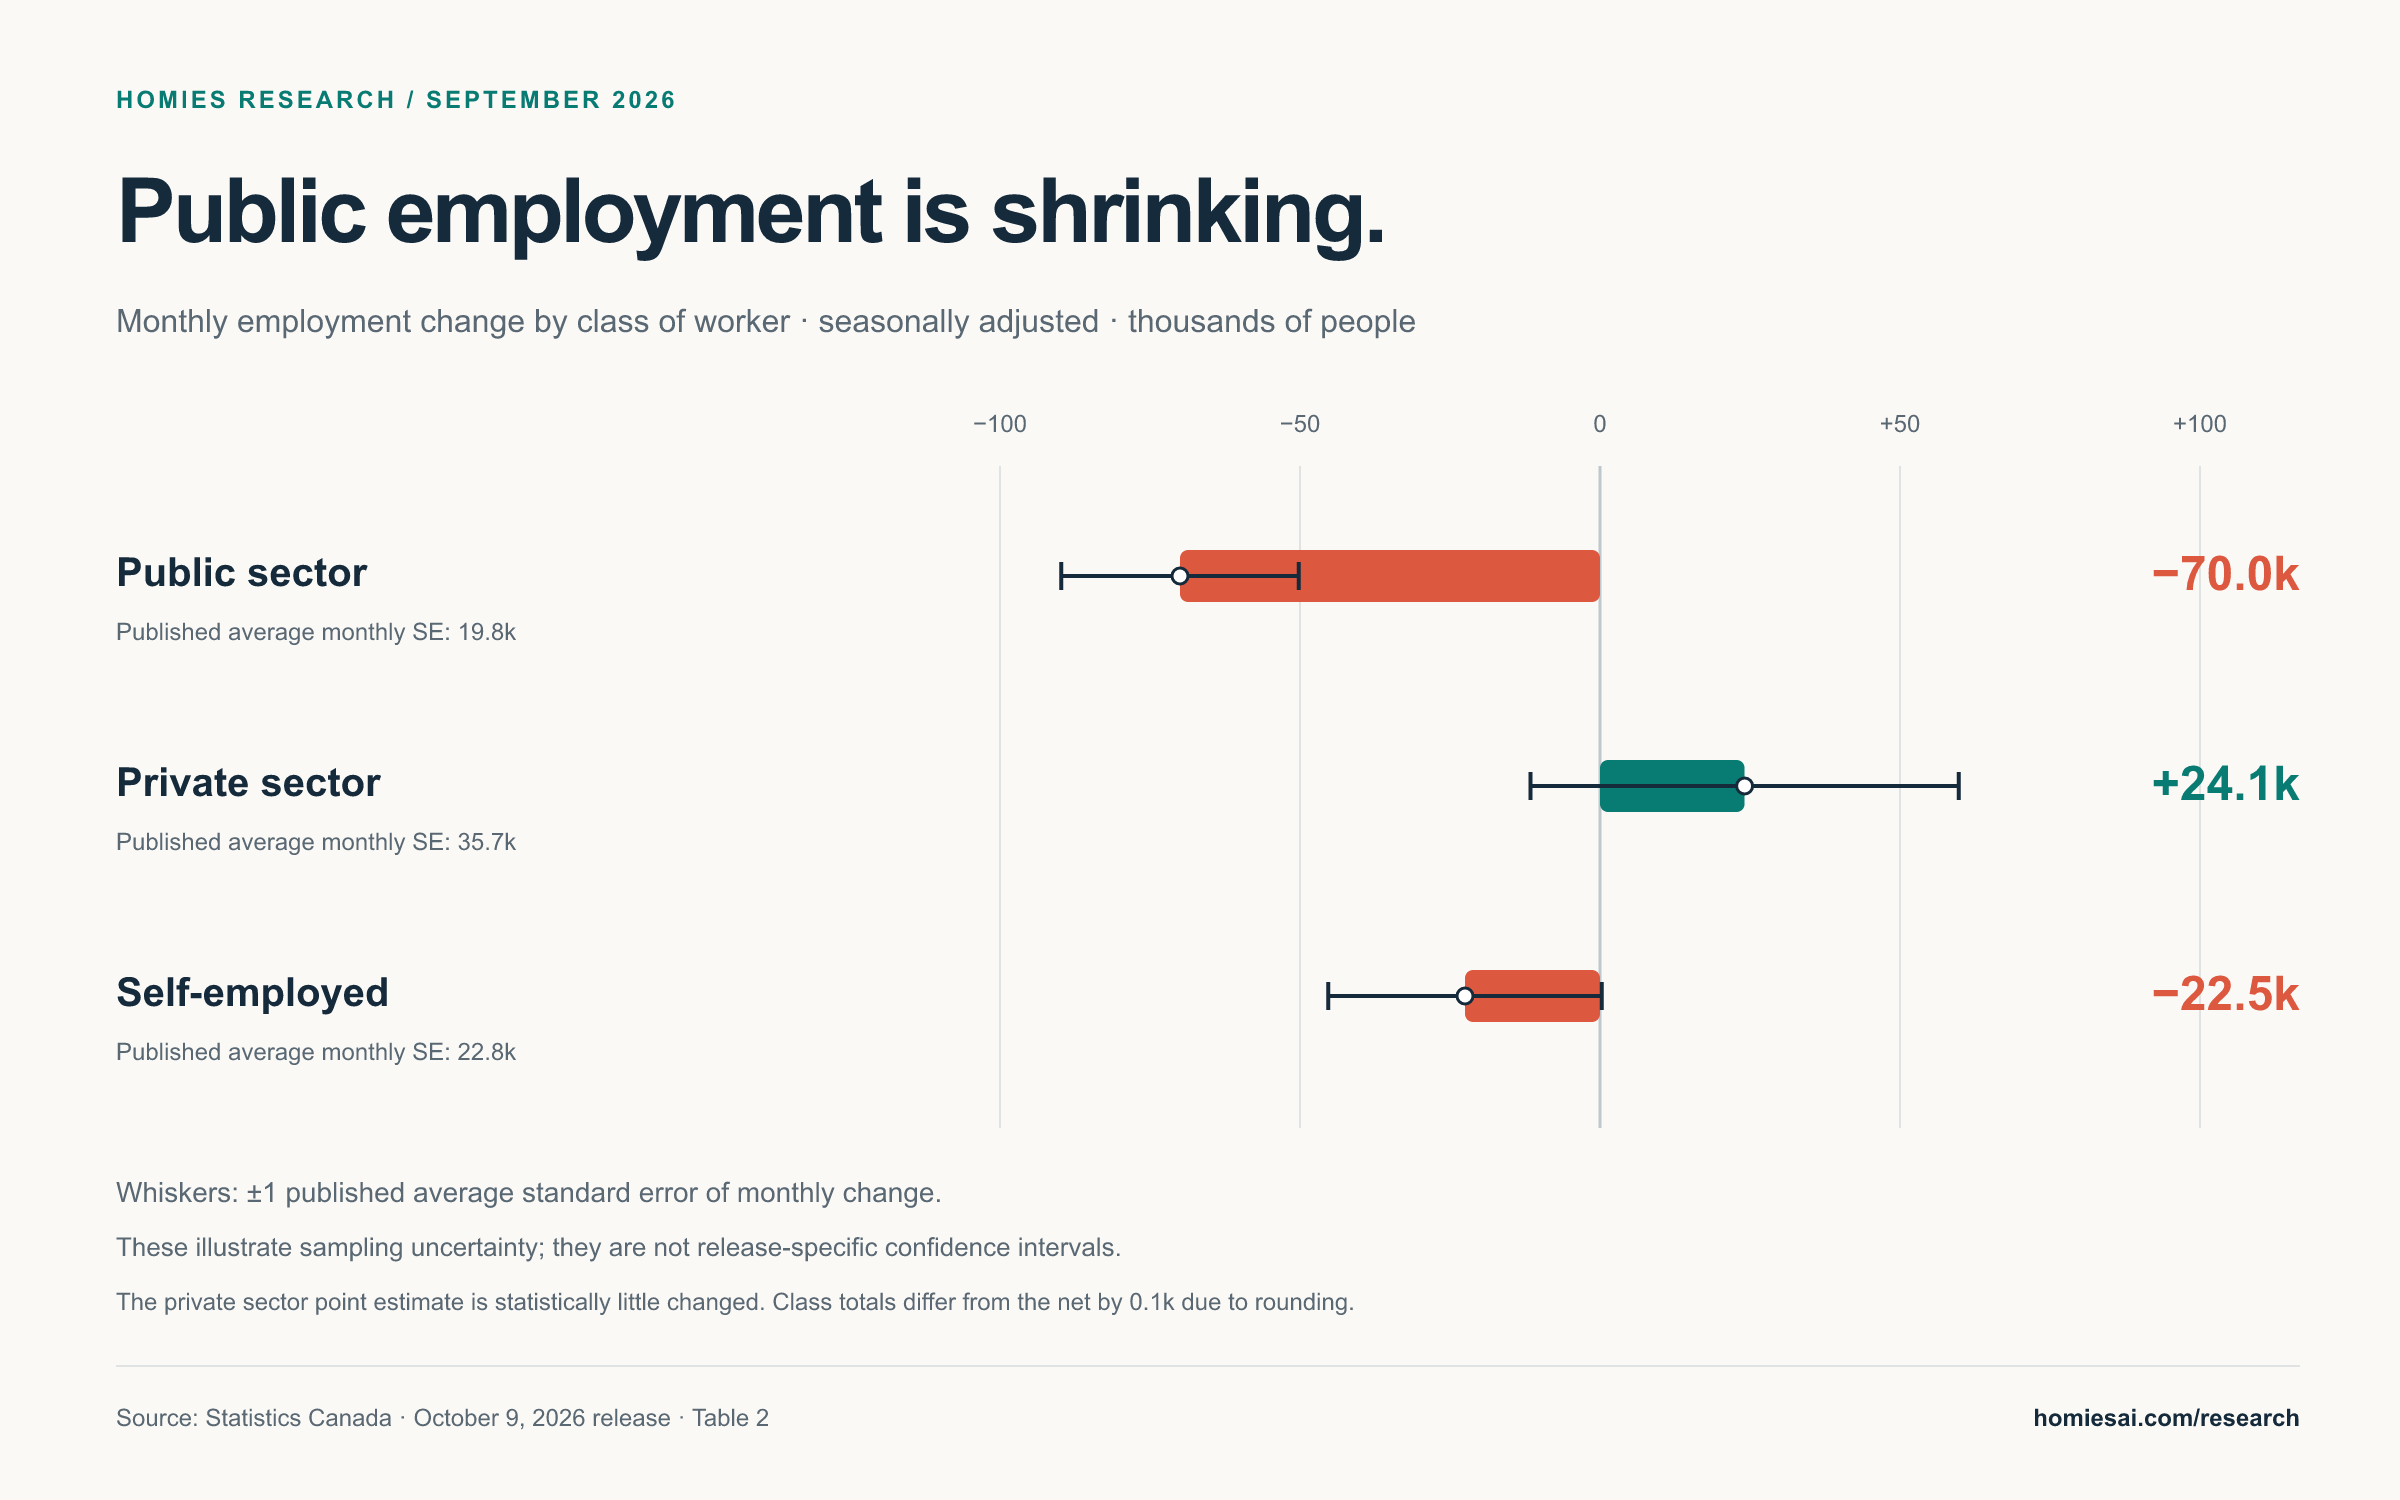
The public sector lost 70,000 employees in September, its fourth consecutive monthly decline. That is a 1.5% monthly contraction; employment is 118,700 below September 2025.
The private sector’s estimated 24,100 increase partly offset the fall. Statistics Canada describes the monthly result as little changed, while the annual increase of 163,000 is clearer evidence of growth. Self-employment fell by 22,500 in the month but remains 50,500 above a year earlier.
The monthly loss is larger than the net total because other categories partly offset it.
Public and private employment describe who employs the worker. Industries describe what the establishment does. Public administration is only one industry: its monthly point estimate was −2,800, far smaller than the public sector decline.
Source: StatCan, release Table 2. Seasonally adjusted. Whiskers show ±1 published average standard error of monthly change; they illustrate sampling uncertainty and are not release-specific confidence intervals. The private sector’s +24.1k monthly point estimate is described as little changed.
View the underlying data
| Category | Aug 2026 | Sep 2026 | Monthly Δ | Monthly Δ SE | Annual Δ | Monthly % | Annual % |
|---|---|---|---|---|---|---|---|
| Public sector employees | 4,517.9 | 4,447.9 | −70.0 | 19.8 | −118.7 | −1.5 | −2.6 |
| Private sector employees | 13,891.9 | 13,916.0 | +24.1 | 35.7 | +163.0 | +0.2 | +1.2 |
| Self-employed | 2,763.4 | 2,740.9 | −22.5 | 22.8 | +50.5 | −0.8 | +1.9 |
Class-of-worker point estimates sum to −68.4k; the official national change is −68.3k. The 0.1k difference reflects independently rounded estimates.
Age cohorts
Youth explain 70% of the net decline. The rate alone misses the pressure.
70.4%
of September’s net employment decline came from youth.
Youth aged 15–24 lost 48,100 jobs, a 1.8% monthly decline. But their labour force also fell by 50,100, leaving their unemployment rate little changed at 13.0% (+0.1 percentage points).
An unemployment rate divides the number unemployed by the labour force. When that denominator contracts alongside employment, a small rate movement can coexist with a large loss of jobs.
The youth employment rate fell a full percentage point to 54.1%. This complements the unemployment rate by measuring employment against the entire youth population.
Monthly change
Monthly change
Monthly change
70.4% = 48.1 ÷ 68.3 × 100. This is a share of the net decline, not a share of all job losses. Labour force accounting differs by 0.1k due to rounding; the data do not establish why people left the labour force.
Source: StatCan, release Table 1. Seasonally adjusted. These three age groups are mutually exclusive; their changes sum to −68.3k.
View the underlying data
| Category | Aug 2026 | Sep 2026 | Monthly Δ | Annual Δ | Monthly % | Annual % |
|---|---|---|---|---|---|---|
| 15 to 24 years | 2,724.1 | 2,676.0 | −48.1 | −11.9 | −1.8 | −0.4 |
| 25 to 54 years | 14,107.2 | 14,079.7 | −27.5 | +85.5 | −0.2 | +0.6 |
| 55 years and over | 4,341.8 | 4,349.1 | +7.3 | +21.4 | +0.2 | +0.5 |
View the underlying data
| Category | Aug 2026 | Sep 2026 | Monthly Δ | Annual Δ |
|---|---|---|---|---|
| 15 to 24 years | 12.9 | 13.0 | +0.1 | −1.6 |
| 25 to 54 years | 5.5 | 5.6 | +0.1 | −0.4 |
| 55 years and over | 5.1 | 5.3 | +0.2 | −0.1 |
Gender within age groups
Core-aged women faced a different month than core-aged men.
Among people aged 25–54, employment fell for women while it held steady for men. For people aged 55+, gains among women outweighed a decline among men. These subgroup changes show why a single national headline is incomplete.
Employment fell 0.4% in September. Unemployment rose 0.3 pp to 5.3%; the number unemployed increased 17,500. The rate remains 0.5 pp below a year earlier.
Employment was steady. Unemployment fell 0.2 pp to 5.8%, with 11,300 fewer unemployed. Employment remains 50,400 above a year earlier.
The employment point estimate rose: women+ +19.1k, men+ −11.8k. Unemployment increased 0.2 pp to 5.3% as the labour force grew.
Source: StatCan, Table 1. Seasonally adjusted. Men+ and Women+ include some non-binary respondents, distributed across these categories to protect confidentiality. Small subgroup changes are point estimates, not necessarily statistically significant.
Geographic divergence
Quebec’s contraction and Alberta’s growth tell different stories.
Quebec lost 49,400 jobs in September and its unemployment rate rose 0.4 pp to 6.0%. The release reports a cumulative 130,000 decline from January to September. Employment is 94,600 below a year earlier.
Alberta added 23,100 jobs and its unemployment rate fell 0.4 pp to 6.4%. Employment is 75,700 higher than a year earlier. British Columbia lost 20,200 jobs, Ontario edged down 20,000, and Manitoba lost 4,400.
A national jobs report is a starting point for a local conversation. Switch to percentage change to compare growth rates without letting the largest provinces dominate the chart.
Source: StatCan, release Table 3. Seasonally adjusted. Percent mode compares the pace of change across differently sized labour markets. Small monthly moves may be sampling variation.
View the underlying data
| Category | Aug 2026 | Sep 2026 | Monthly Δ | Annual Δ | Monthly % | Annual % |
|---|---|---|---|---|---|---|
| Newfoundland and Labrador | 245.0 | 246.8 | +1.8 | +5.8 | +0.7 | +2.4 |
| Prince Edward Island | 95.6 | 96.6 | +1.0 | +3.5 | +1.0 | +3.8 |
| Nova Scotia | 540.5 | 540.7 | +0.2 | +16.1 | 0.0 | +3.1 |
| New Brunswick | 408.6 | 407.9 | −0.7 | +2.1 | −0.2 | +0.5 |
| Quebec | 4,588.7 | 4,539.3 | −49.4 | −94.6 | −1.1 | −2.0 |
| Ontario | 8,306.5 | 8,286.5 | −20.0 | +86.3 | −0.2 | +1.1 |
| Manitoba | 756.1 | 751.7 | −4.4 | +12.3 | −0.6 | +1.7 |
| Saskatchewan | 621.8 | 622.1 | +0.3 | +2.3 | 0.0 | +0.4 |
| Alberta | 2,661.1 | 2,684.2 | +23.1 | +75.7 | +0.9 | +2.9 |
| British Columbia | 2,949.2 | 2,929.0 | −20.2 | −14.5 | −0.7 | −0.5 |
View the underlying data
| Category | Aug 2026 | Sep 2026 | Monthly Δ | Annual Δ |
|---|---|---|---|---|
| Newfoundland and Labrador | 8.6 | 9.1 | +0.5 | −1.4 |
| Prince Edward Island | 7.9 | 7.3 | −0.6 | −2.2 |
| Nova Scotia | 6.1 | 6.3 | +0.2 | +0.1 |
| New Brunswick | 7.3 | 7.4 | +0.1 | −0.5 |
| Quebec | 5.6 | 6.0 | +0.4 | +0.3 |
| Ontario | 6.9 | 7.0 | +0.1 | −0.9 |
| Manitoba | 5.0 | 5.0 | 0.0 | −1.2 |
| Saskatchewan | 6.0 | 5.4 | −0.6 | −0.6 |
| Alberta | 6.8 | 6.4 | −0.4 | −1.3 |
| British Columbia | 6.5 | 6.4 | −0.1 | 0.0 |
Unemployment rate: 7.4%. Employment down 32.2k year over year.
Unemployment rate: 7.2%. Employment up 66.9k year over year.
Unemployment rate: 7.1%. Employment up 10.8k year over year.
CMA cards use the single-month seasonally adjusted estimates in Table 8. Other CMA estimates in Table 7 use three-month moving averages and should not be mixed with these monthly observations.
The full industry picture
Education and health care led the losses. Annual trends add perspective.
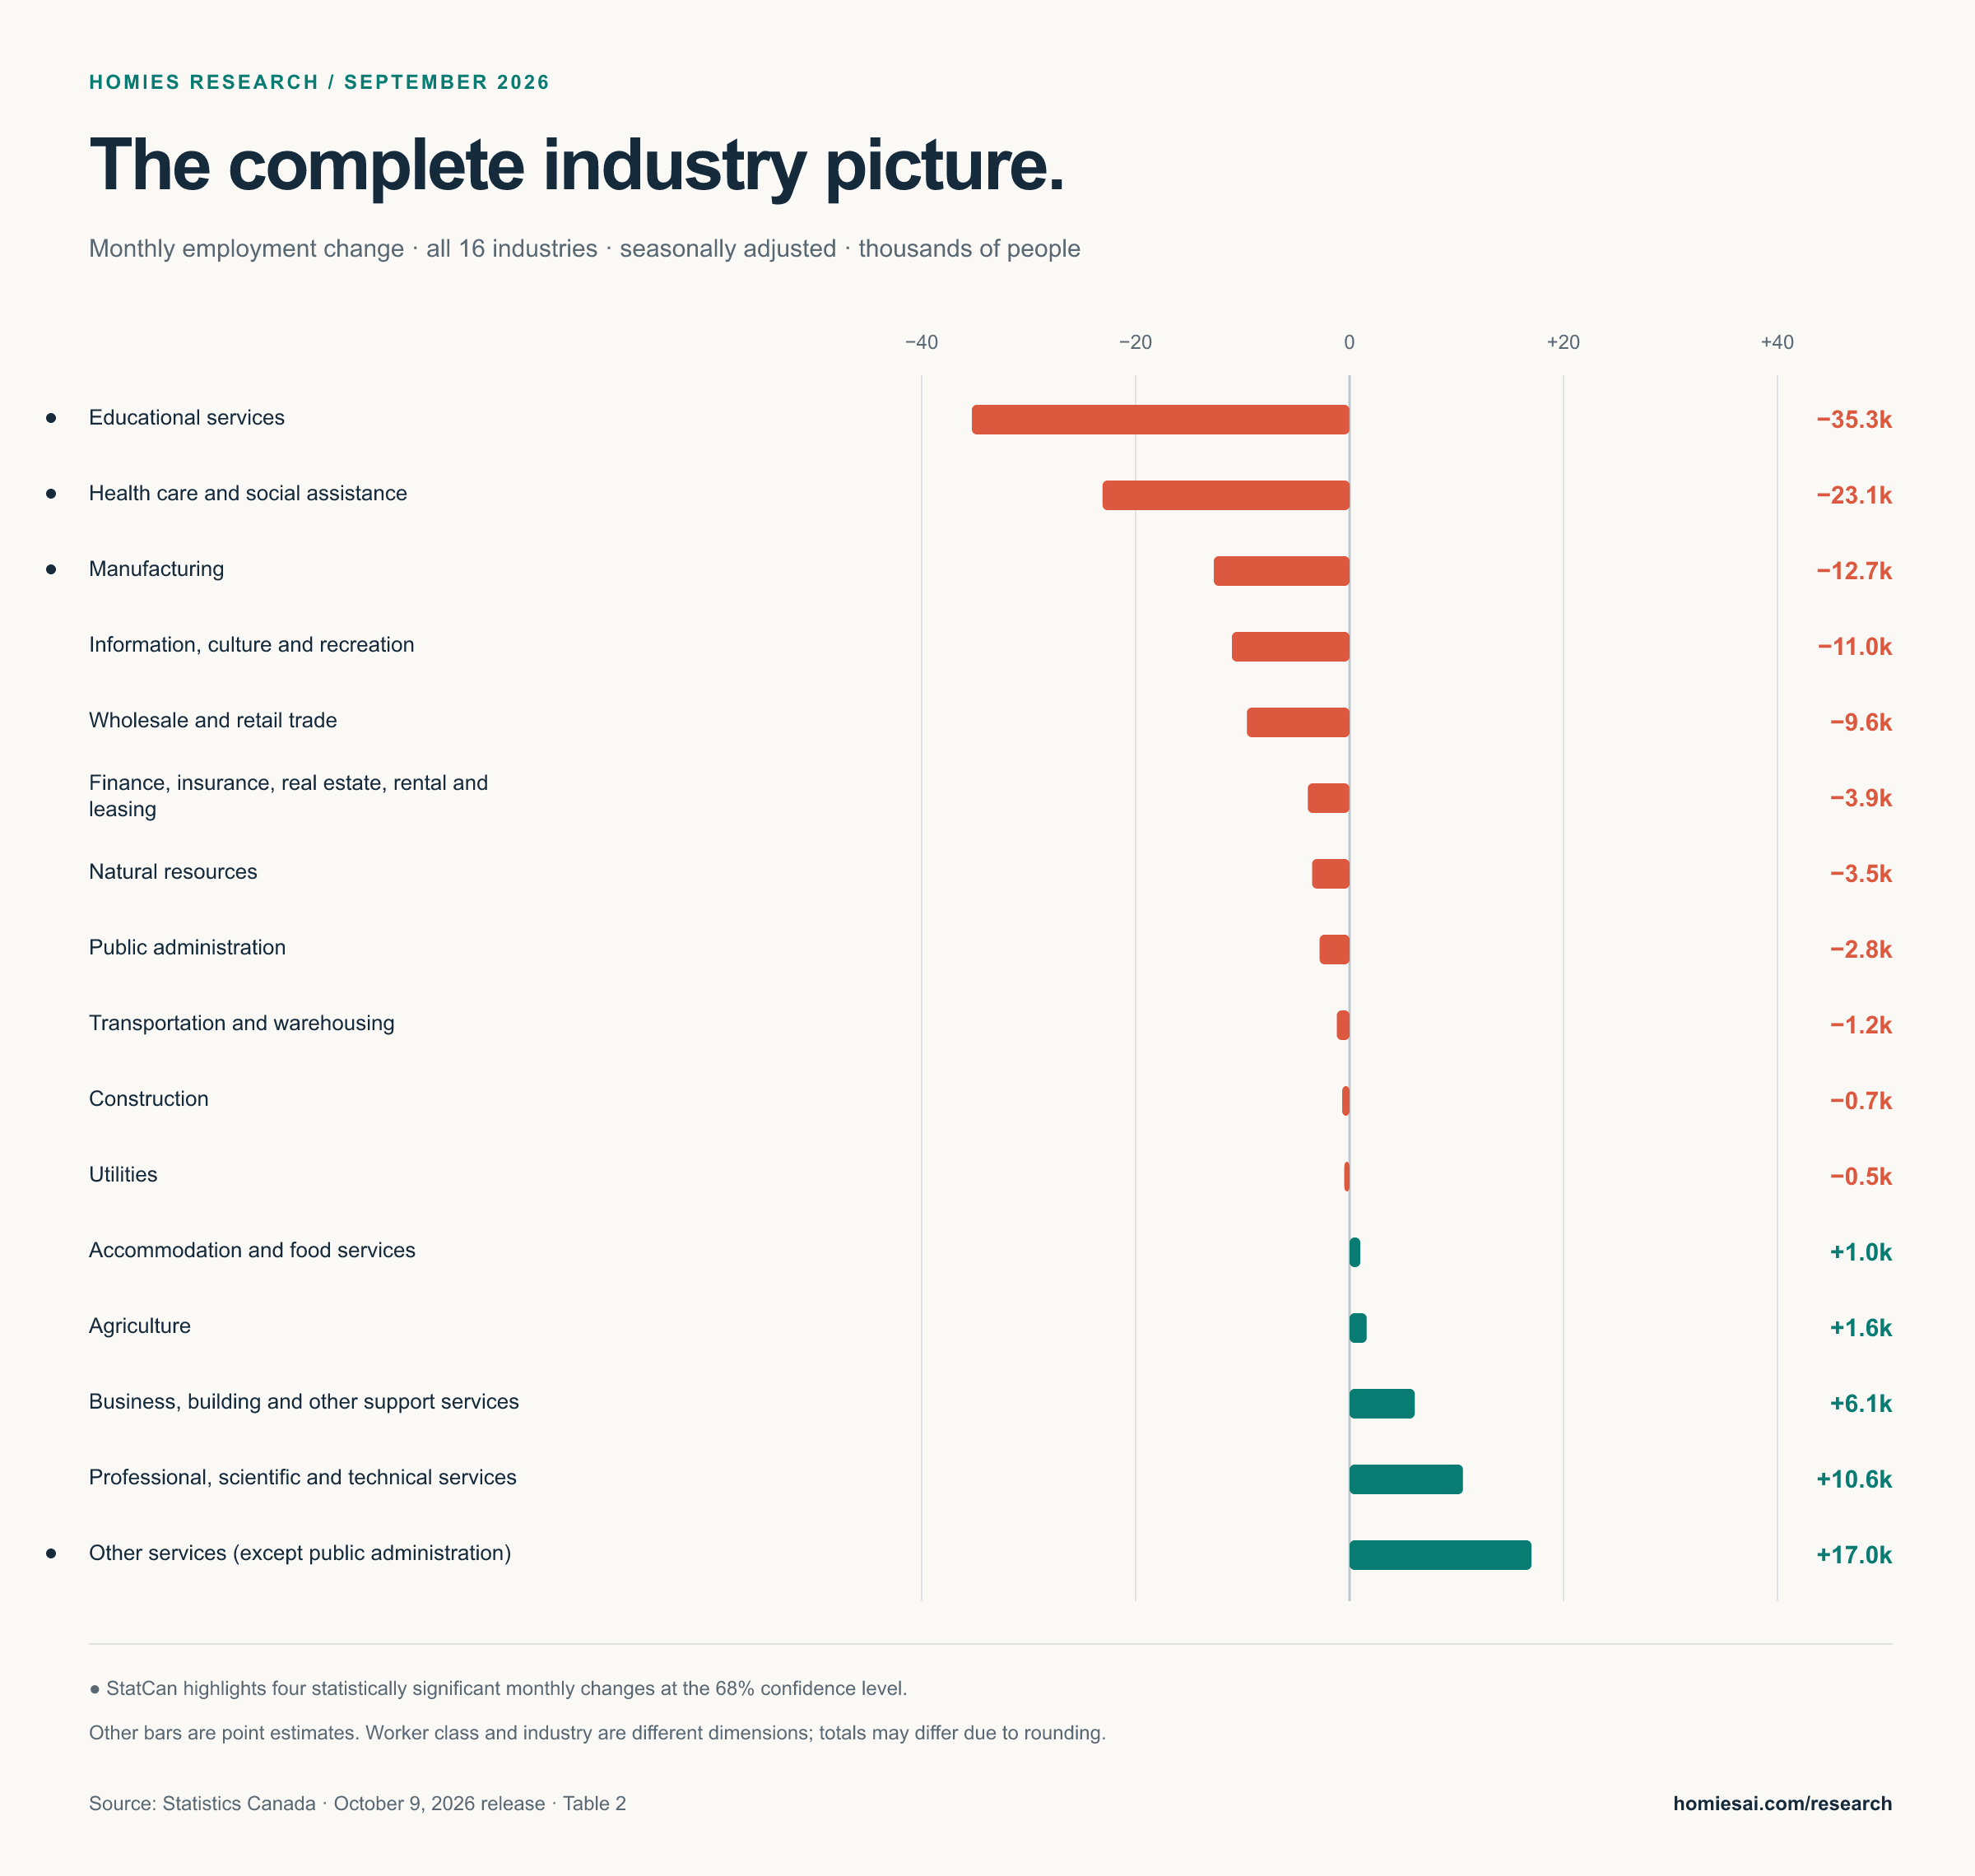
Educational services fell 35,300 and health care and social assistance fell 23,100. Manufacturing fell 12,700; other services added 17,000. Health care’s monthly decline was its first since December 2022, yet its 93,000 annual gain remained the largest industry contribution to year-over-year employment growth.
Source: StatCan, release Table 2. All 16 non-overlapping industry groups; sector subtotals excluded. Seasonally adjusted. The release highlights four monthly changes: education, health care, manufacturing and other services. Other bars remain point estimates.
View the underlying data
| Category | Aug 2026 | Sep 2026 | Monthly Δ | Annual Δ | Monthly % | Annual % |
|---|---|---|---|---|---|---|
| Agriculture | 215.2 | 216.8 | +1.6 | −13.9 | +0.7 | −6.0 |
| Natural resources | 331.4 | 327.9 | −3.5 | −10.1 | −1.1 | −3.0 |
| Utilities | 156.6 | 156.1 | −0.5 | −9.9 | −0.3 | −6.0 |
| Construction | 1,647.5 | 1,646.8 | −0.7 | +20.0 | 0.0 | +1.2 |
| Manufacturing | 1,847.0 | 1,834.3 | −12.7 | −12.9 | −0.7 | −0.7 |
| Wholesale and retail trade | 2,954.3 | 2,944.7 | −9.6 | −46.9 | −0.3 | −1.6 |
| Transportation and warehousing | 1,120.4 | 1,119.2 | −1.2 | +52.8 | −0.1 | +5.0 |
| Finance, insurance, real estate, rental and leasing | 1,482.5 | 1,478.6 | −3.9 | −25.7 | −0.3 | −1.7 |
| Professional, scientific and technical services | 2,026.8 | 2,037.4 | +10.6 | +29.8 | +0.5 | +1.5 |
| Business, building and other support services | 687.3 | 693.4 | +6.1 | +19.1 | +0.9 | +2.8 |
| Educational services | 1,575.1 | 1,539.8 | −35.3 | −67.4 | −2.2 | −4.2 |
| Health care and social assistance | 3,015.9 | 2,992.8 | −23.1 | +93.0 | −0.8 | +3.2 |
| Information, culture and recreation | 890.1 | 879.1 | −11.0 | +43.3 | −1.2 | +5.2 |
| Accommodation and food services | 1,193.9 | 1,194.9 | +1.0 | +10.5 | +0.1 | +0.9 |
| Other services (except public administration) | 797.0 | 814.0 | +17.0 | +32.2 | +2.1 | +4.1 |
| Public administration | 1,231.9 | 1,229.1 | −2.8 | −18.8 | −0.2 | −1.5 |
Momentum and job quality
Both full-time and part-time employment fell. Hiring is getting harder.
Employment by usual work schedule
Full-time is usually 30 or more hours per week at the main job; part-time is fewer than 30. These are seasonally adjusted employment estimates, not measures of how many hours were actually worked.
View the underlying data
| Category | Aug 2026 | Sep 2026 | Monthly Δ | Annual Δ | Monthly % | Annual % |
|---|---|---|---|---|---|---|
| Full-time | 17,325.7 | 17,290.3 | −35.4 | +35.0 | −0.2 | +0.2 |
| Part-time | 3,847.4 | 3,814.5 | −32.9 | +59.9 | −0.9 | +1.6 |
Average hourly pay is growing slowly
Average usual weekly hours were 35.5, unchanged from September 2025. Wage growth rose from 2.0% in August. These are nominal wages; the release does not establish an inflation-adjusted pay increase.
Source: Table 11. Employees only; not seasonally adjusted; current Canadian dollars. Group averages are not adjusted for differences in occupation, hours or experience.
View wages and usual hours
| Group | Sep 2025 $/hour | Sep 2026 $/hour | Sep 2026 hours/week |
|---|---|---|---|
| 15 years and over | $36.78 | $37.64 | 35.5 |
| 15 to 24 years | $21.86 | $22.60 | 26.8 |
| 25 years and over | $39.14 | $40.00 | 36.9 |
| Men+ | $38.94 | $39.84 | 37.5 |
| Women+ | $34.49 | $35.32 | 33.4 |
The share unemployed in August who found a job in September. Down from 32.8% a year earlier and 36.5% on average in 2017–2019.
The share employed in August who became unemployed in September due to layoff. Similar to 0.6% a year earlier and the pre-pandemic average.
September followed an approximately 42,000 employment decline in August, after a 181,000 gain from April to July. National employment remains higher than a year earlier.
Job-finding and layoff measures describe flows between survey months; employment counts describe the net stock. Different denominators and seasonal bases prevent a direct comparison of their percentages.
Employment rate: the recovery lost momentum
View monthly series
| Month | Rate |
|---|---|
| 2025-01 | 61.1% |
| 2025-02 | 61.0% |
| 2025-03 | 60.9% |
| 2025-04 | 60.8% |
| 2025-05 | 60.7% |
| 2025-06 | 60.9% |
| 2025-07 | 60.7% |
| 2025-08 | 60.5% |
| 2025-09 | 60.6% |
| 2025-10 | 60.8% |
| 2025-11 | 60.9% |
| 2025-12 | 60.9% |
| 2026-01 | 60.8% |
| 2026-02 | 60.6% |
| 2026-03 | 60.6% |
| 2026-04 | 60.5% |
| 2026-05 | 60.7% |
| 2026-06 | 60.8% |
| 2026-07 | 60.9% |
| 2026-08 | 60.8% |
| 2026-09 | 60.6% |
Unemployment: still below April’s peak
View monthly series
| Month | Rate |
|---|---|
| 2025-01 | 6.7% |
| 2025-02 | 6.6% |
| 2025-03 | 6.8% |
| 2025-04 | 6.9% |
| 2025-05 | 7.0% |
| 2025-06 | 6.9% |
| 2025-07 | 6.9% |
| 2025-08 | 7.1% |
| 2025-09 | 7.1% |
| 2025-10 | 6.9% |
| 2025-11 | 6.6% |
| 2025-12 | 6.8% |
| 2026-01 | 6.5% |
| 2026-02 | 6.7% |
| 2026-03 | 6.7% |
| 2026-04 | 6.9% |
| 2026-05 | 6.6% |
| 2026-06 | 6.5% |
| 2026-07 | 6.4% |
| 2026-08 | 6.4% |
| 2026-09 | 6.5% |
The denominator matters
An aging population is pushing participation down.
The seasonally adjusted participation rate fell to 64.8%, its lowest level since December 1997 outside 2020. That deserves context: the population is aging, and older people participate in the labour market at lower rates.
People aged 65+ now represent 23.2% of the survey population aged 15+, compared with 20.5% in September 2019. StatCan’s calculation using a constant September 2019 age mix finds participation little changed year over year (−0.1 pp), versus an observed −0.4 pp decline.
September-only, unadjusted
2019 age composition held constant
The effect of a changing age mix
Source: official release Chart 4. September observations only, 2019–2026; not seasonally adjusted. Vertical axis does not start at zero. The 64.6% observed value here differs from the seasonally adjusted 64.8% headline.
View age composition calculation
| September | Observed | 2019 age mix |
|---|---|---|
| 2019 | 65.9% | 65.9% |
| 2020 | 65.3% | 65.6% |
| 2021 | 65.7% | 66.4% |
| 2022 | 65.1% | 66.1% |
| 2023 | 65.6% | 66.6% |
| 2024 | 65.1% | 66.1% |
| 2025 | 65.0% | 66.2% |
| 2026 | 64.6% | 66.1% |
What this means for real estate conversations
Use the local jobs story to make the housing conversation more useful.
The following are practical interpretations, not measured housing effects. A jobs release alone cannot establish where home prices, rents, mortgage arrears or interest rates will move.
Discuss first-time buyer timelines
Youth employment weakness may matter for saving a down payment and income qualification. Ask clients about their own work and financing plans, and use the employment rate alongside the unemployment rate.
Look at the local employer mix
Public sector exposure deserves attention in markets reliant on schools, hospitals or government employers. Combine local sector evidence with listings, sales and prices before forming a housing view.
Write different reports for different markets
Alberta’s employment growth and Quebec’s contraction support different client conversations. Toronto, Montréal and Vancouver also show different monthly readings; choose the matching geography and time basis.
Reproducible by design
Every number has a source. Every comparison has a basis.
Download the complete source package
This report uses Statistics Canada’s Labour Force Survey, September 2026, released October 9, 2026. The reference week was September 13–19, 2026.
All 12 release tables, five official chart series and release-text indicators are available through the Homies statistics library. The figures on this page retain the release’s original precision and data vintage.
Vector exports: Sector SVG · Industry SVG · Source manifest
How to read the data
- Survey estimates, not an administrative count. The LFS samples approximately 65,000 households, with over 100,000 respondents each month. Estimates have sampling variability and may be revised.
- Seasonal adjustment. Monthly employment and rate comparisons are seasonally adjusted unless explicitly labelled otherwise. Wages and the age composition illustration are unadjusted. Different bases are kept separate.
- Geography and time windows. Canada excludes the territories. Most CMA, territory and EI regional estimates are three-month averages. Table 8 supplies separate monthly estimates for Montréal, Toronto and Vancouver.
- Statistical significance. StatCan’s release discussion focuses on differences significant at the 68% confidence level. Small bars remain point estimates. “Little changed” is not evidence that the underlying change is exactly zero.
- Units and rounding. k means thousand people. Rates are percentages; rate changes are percentage points (pp). Totals may not add due to rounding. Null or suppressed values are not zero.
- Average standard errors. The release tables publish the average standard error of change between consecutive months. This is neither the standard error of an employment level nor an annual-change standard error.
- Wages and hours. Wages cover employees, are in current Canadian dollars and are not adjusted for inflation or worker composition. Usual weekly hours are distinct from actual hours worked.
- Gender categories. Men+ and Women+ include some non-binary respondents, allocated to protect confidentiality. Youth gender detail is not provided in the national age table; no unsupported estimate is inferred.
Analysis and visualization: Daniel Foch / Homies Research. Source: Statistics Canada, Labour Force Survey, September 2026. The employment counts describe people with jobs, not a count of vacancies or job postings. The next scheduled release is November 6, 2026, covering October. Any housing interpretation is explicitly identified as an inference.
Better data. Better client conversations.
Explore all labour market data