The race to 2%.
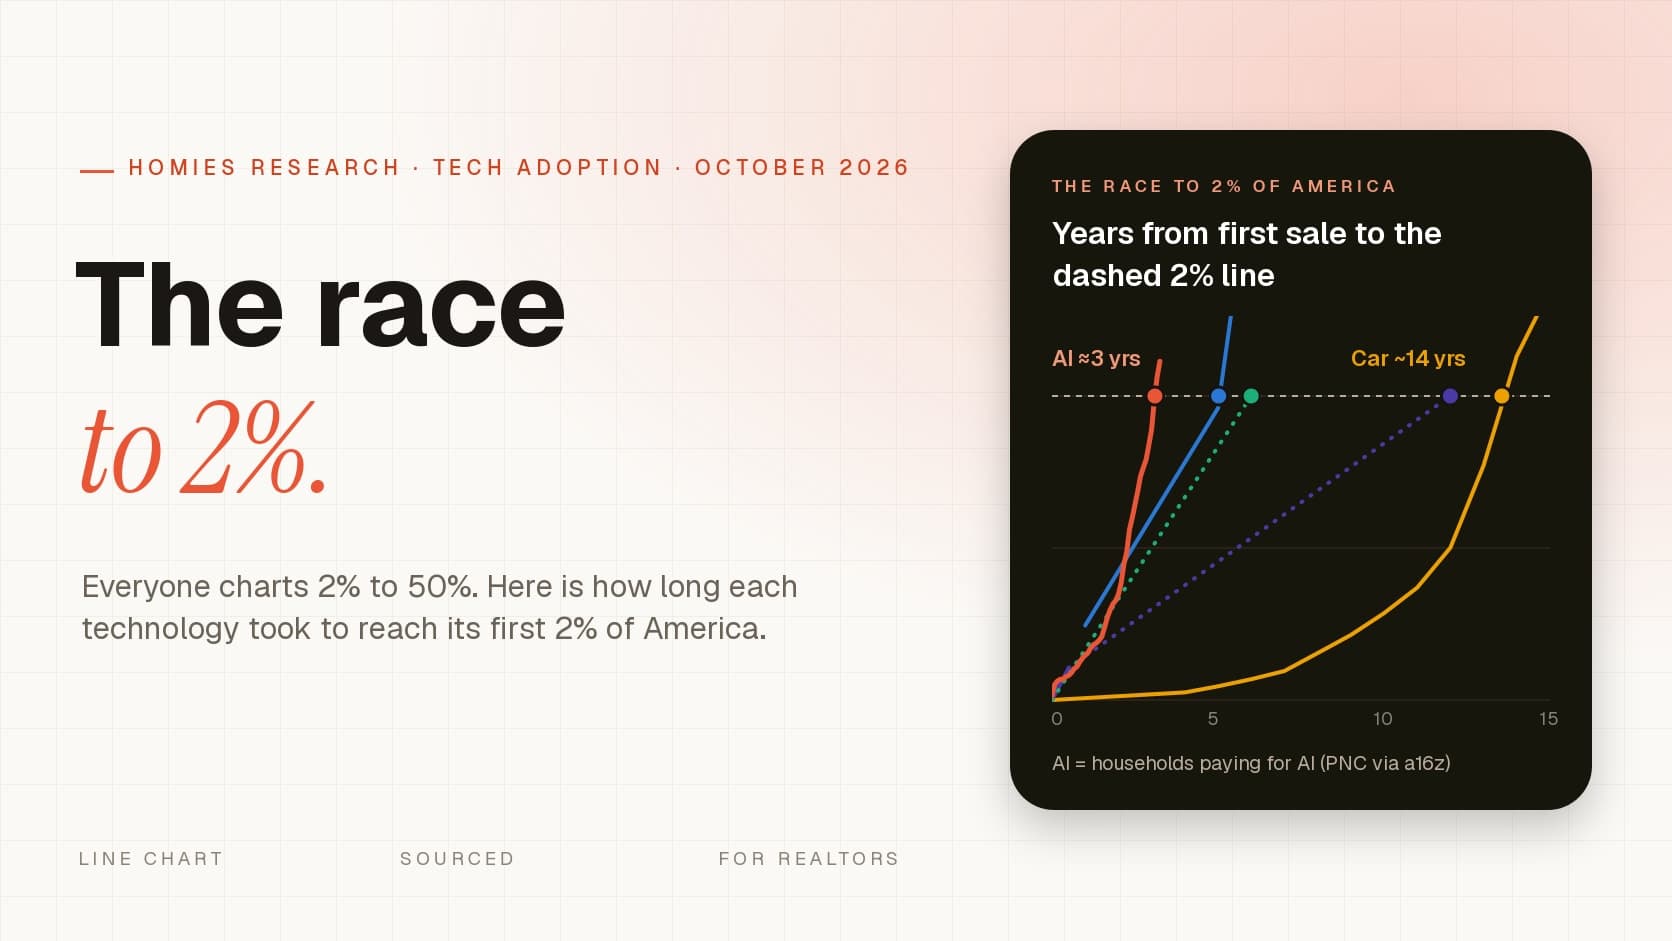
A chart going around shows how long cars, computers, the internet and smartphones took to go from 2% of America to half — and that paid AI just reached 2%. We charted the part before it: how long each one took to get to 2% in the first place.
The question
Start the clock when the first product went on sale to American consumers. How many years until 2% of America had one?
The answer
Cars 14 years, smartphones 12, computers 6, the internet 5. Paid AI: about 3.
The catch
AI’s 2% is households paying for it. On use, AI blew past 2% within months.
Chart 1
Years to reach 2% of America
On October 4, Ruben Hassid posted a chart of how long four technologies took to go from 2% to 50% adoption in the US — smartphones 6.5 years, the internet 7.5, cars 15, computers 19 — with AI “at year zero” after a16z showed 2.2% of US households now pay for AI. It starts every line at 2%. So how long did it take each of them to get there?
Chart 1 · The race to 2%
Share of America using each technology, by years since its first product went on sale
Car
1896 → 1910
~14 yrs
Smartphone
1994 → 2006
~12 yrs
Computer
1975 → 1981
~6 yrs
Internet
1989 → 1994
~5 yrs
Paid AI
2023 → 2026
≈3 yrs
Dots are measurements; dotted lines cross years with no measurement. Hover a dot for its value and source.
Show the data
| Series | When | Years in | Adoption |
|---|---|---|---|
| Car | 1896 | 0.0 | 0.00% |
| Car | 1900 | 4.0 | 0.05% |
| Car | 1901 | 5.0 | 0.09% |
| Car | 1902 | 6.0 | 0.14% |
| Car | 1903 | 7.0 | 0.19% |
| Car | 1904 | 8.0 | 0.31% |
| Car | 1905 | 9.0 | 0.43% |
| Car | 1906 | 10.0 | 0.57% |
| Car | 1907 | 11.0 | 0.74% |
| Car | 1908 | 12.0 | 1.0% |
| Car | 1909 | 13.0 | 1.5% |
| Car | 1910 | 14.0 | 2.3% |
| Car | 1911 | 15.0 | 3.0% |
| Smartphone | Aug 1994 | 0.0 | 0.00% |
| Smartphone | Feb 1995 | 0.5 | 0.21% |
| Smartphone | 2006 | 12.0 | 2.0% (estimate) |
| Computer | Jan 1975 | 0.0 | 0.00% |
| Computer | 1981 | 6.0 | 2.0% (estimate) |
| Internet | 1990 | 1.0 | 0.49% |
| Internet | Winter 1994 | 5.0 | 1.9% |
| Internet | Jun 1995 | 5.5 | 4.5% |
| Paid AI | Feb 2023 | 0.0 | 0.03% |
| Paid AI | Mar 2023 | 0.1 | 0.10% |
| Paid AI | Apr 2023 | 0.2 | 0.13% |
| Paid AI | May 2023 | 0.3 | 0.14% |
| Paid AI | Jun 2023 | 0.3 | 0.14% |
| Paid AI | Jul 2023 | 0.4 | 0.15% |
| Paid AI | Aug 2023 | 0.5 | 0.16% |
| Paid AI | Sep 2023 | 0.6 | 0.18% |
| Paid AI | Oct 2023 | 0.7 | 0.21% |
| Paid AI | Nov 2023 | 0.8 | 0.22% |
| Paid AI | Dec 2023 | 0.8 | 0.25% |
| Paid AI | Jan 2024 | 0.9 | 0.28% |
| Paid AI | Feb 2024 | 1.0 | 0.30% |
| Paid AI | Mar 2024 | 1.1 | 0.31% |
| Paid AI | Apr 2024 | 1.2 | 0.34% |
| Paid AI | May 2024 | 1.3 | 0.36% |
| Paid AI | Jun 2024 | 1.3 | 0.38% |
| Paid AI | Jul 2024 | 1.4 | 0.39% |
| Paid AI | Aug 2024 | 1.5 | 0.42% |
| Paid AI | Sep 2024 | 1.6 | 0.48% |
| Paid AI | Oct 2024 | 1.7 | 0.54% |
| Paid AI | Nov 2024 | 1.8 | 0.59% |
| Paid AI | Dec 2024 | 1.8 | 0.63% |
| Paid AI | Jan 2025 | 1.9 | 0.65% |
| Paid AI | Feb 2025 | 2.0 | 0.69% |
| Paid AI | Mar 2025 | 2.1 | 0.77% |
| Paid AI | Apr 2025 | 2.2 | 0.89% |
| Paid AI | May 2025 | 2.3 | 0.97% |
| Paid AI | Jun 2025 | 2.3 | 1.1% |
| Paid AI | Jul 2025 | 2.4 | 1.2% |
| Paid AI | Aug 2025 | 2.5 | 1.3% |
| Paid AI | Sep 2025 | 2.6 | 1.4% |
| Paid AI | Oct 2025 | 2.7 | 1.5% |
| Paid AI | Nov 2025 | 2.8 | 1.5% |
| Paid AI | Dec 2025 | 2.8 | 1.6% |
| Paid AI | Jan 2026 | 2.9 | 1.7% |
| Paid AI | Feb 2026 | 3.0 | 1.8% |
| Paid AI | Mar 2026 | 3.1 | 2.0% |
| Paid AI | Apr 2026 | 3.2 | 2.1% |
| Paid AI | May 2026 | 3.3 | 2.2% |
≈3 yrs
ChatGPT Plus (Feb 2023) to 2% of US households paying for AI
5 yrs
the fastest of the rest — the internet, 1989 to 1994
14 yrs
the slowest — cars, from the first Duryea sales to 1910
Chart 2
The whole journey, start to half
Put the two halves together and the shapes differ more than the headline suggests. Cars were slow both ways: 14 years to 2%, 15 more to 50%. Smartphones incubated for more than a decade among executives with BlackBerrys and Treos, then went mainstream in six and a half years. Computers did the opposite — a quick start among hobbyists, then a two-decade grind into the average home.
Chart 2 · The whole journey
Years from the first product on sale, to 2% of America, to 50%
- First product → 2%
- 2% → 50%
- Car · 1896 → 1910 → 192514 yrs + 15 yrs
- Smartphone · 1994 → 2006 → 201312 yrs + 6.5 yrs
- Computer · 1975 → 1981 → 20006 yrs + 19 yrs
- Internet · 1989 → 1994 → 20015 yrs + 7.5 yrs
- AI (paid) · 2023 → 2026 → ?3 yrs + ?
- Year 0 of the climb
Years after the first product went on sale
The internet was fast on both legs, but its 2% line in 1994 was mostly AOL, Prodigy and CompuServe subscribers — about 5 million Americans in the winter of 1994, per the Times Mirror Center . Those services had been on sale since 1979, which is why the start date matters.
Method
When does the clock start?
The 2% end of each bar comes from Hassid’s chart. The start is a judgment call, so we used one rule for all five: the first product of its kind sold to American consumers. Pick a different starting gun and the bars move — sometimes a lot. The table shows the alternatives.
| Technology | Our start | Earlier option | Later option | Years to 2% (range) |
|---|---|---|---|---|
| Car | 1896 · Duryea sales | 1886 · Benz Patent-Motorwagen (Germany) | 1908 · Ford Model T | 14 yrs (2 to 24) |
| Smartphone | 1994 · IBM Simon | 2002 · BlackBerry 5810 and Treo 180 | 2007 · iPhone (after the 2% line) | 12 yrs (4 to 12) |
| Computer | 1975 · Altair 8800 | 1977 · Apple II, PET, TRS-80 | 1981 · IBM PC | 6 yrs (0 to 6) |
| Internet | 1989 · The World | 1979 · CompuServe consumer service | 1991 · World Wide Web public | 5 yrs (3 to 15) |
| AI (paid) | Feb 2023 · ChatGPT Plus | Nov 2022 · ChatGPT (free) | — | about 3 yrs |
Two of these are worth a second look. The iPhone launched in June 2007, after smartphones had already crossed 2% of US mobile subscribers — Telephia counted 3.8% among recent device buyers by the third quarter of 2006. And if you start the internet clock with CompuServe’s consumer service in 1979 rather than the first commercial internet provider, it took 15 years, not 5.
The 2% dates are as precise as Hassid’s sources allow. Car registrations reached 458,377 in 1910 (FHWA) against about 20 million households, or roughly 2.3%. The 1981 computer figure is an estimate from sales; most estimates put households with a computer under 1% in 1980. Treat every bar as plus or minus a year.
Read this before sharing
AI’s 2% is a harder 2%
Every other line on the chart measures having the thing. AI’s line measures paying for it. PNC’s card-data panel found 2.2% of households paid for a generative AI subscription in May 2026, up from well under 1% in 2023 — and PNC warns its customers may not mirror the country. Bank of America’s figure is closer to 3%.
On use, it is not close. The St. Louis Fed’s Real-Time Population Survey found 39.4% of US adults aged 18 to 64 had used generative AI by August 2024, less than two years after ChatGPT launched — a faster start than the personal computer or the internet had on the authors’ comparison. By that measure, AI’s bar to 2% would be measured in months, and by 2024 it was most of the way to 50%.
So the fair reading is narrower than “AI is at year zero.” Paid AI is at year zero. And it got to the starting line faster than anything else on the chart.
Homies Research reading
What it means for realtors
The time before 2% is when the tools are clumsy, expensive and used by people who don’t mind that. It is also when the habits form. The agents who were on BlackBerrys in 2003 were not smarter than everyone else; they just had four extra years of practice running a business from a phone when the iPhone made it normal.
Paying for AI is where real estate is now. Most agents have tried ChatGPT; few have built it into how listings, follow-up and market updates actually get done. If the smartphone pattern holds — long incubation, then a fast climb — the agents doing that work today are buying the same head start.
Questions
Frequently asked questions
How long did it take each technology to reach 2% adoption in the US?
Measured from the first product sold to American consumers: cars about 14 years (Duryea, 1896, to 1910), smartphones about 12 years (IBM Simon, 1994, to 2006), personal computers about 6 years (Altair 8800, 1975, to 1981), the internet about 5 years (The World, 1989, to 1994) and paid AI about 3 years (ChatGPT Plus, February 2023, to early 2026).
How long did it take to go from 2% to 50% adoption?
Per Ruben Hassid's How to AI chart: smartphones about 6.5 years (2006 to 2013), the internet about 7.5 years (1994 to 2001), cars about 15 years (1910 to 1925) and computers about 19 years (1981 to 2000). Paid AI reached 2% of US households in early 2026, so its climb has just started.
Is AI adoption really only 2%?
Only for paying. The 2% figure is the share of US households paying for a generative AI subscription in PNC's card-data panel (2.2% in May 2026). Use is far higher: the St. Louis Fed's Real-Time Population Survey found 39.4% of US adults aged 18 to 64 had used generative AI by August 2024.
Does a fast start predict a fast climb to 50%?
Not in this data. Smartphones spent 12 years under 2% and then took only 6.5 years to reach half of America. Computers crossed 2% only 6 years after the Altair but then needed 19 more years to reach 50%. Time to 2% and time from 2% to 50% are not related across these five technologies.
Citations
Sources
- Ruben Hassid (How to AI) — “From 2% to half of America,” X, October 4, 2026
- a16z — State of Markets II (PNC household AI-subscription chart)
- TechDogs — Only 2.2% of PNC households pay for GenAI (PNC Consumer Report, June 2026)
- Bank of America Institute via CBS12 — Can consumers support AI? Just 3% of households are paying subscribers
- Bick, Blandin and Deming — The Rapid Adoption of Generative AI (NBER Working Paper 32966)
- OpenAI — Introducing ChatGPT Plus (February 1, 2023)
- Federal Highway Administration — State motor vehicle registrations, 1900–1995
- Duryea Motor Wagon Company
- Altair 8800
- The World (internet service provider)
- Pew Research Center (Times Mirror) — Americans Going Online… Explosive Growth, Uncertain Destinations (October 16, 1995)
- IBM Simon
- Prodigy (online service) — subscriber history
- CompuServe — subscriber history (Encyclopedia.com company profile)
- MMA / Telephia — Americans lag behind Europeans in smartphone adoption (2006)