Toronto's September: back over $1 million, still falling.
TRREB's Market Watch came out this morning. The average GTA price climbed back above seven figures — but adjust for the season and sales, prices and the benchmark all slipped. Here it is as an interactive report, plus the prompt that rebuilds it for your market under your own brand.
Your brand
The prompt asks for your logo, colours, headshot and CTA — and paints the live charts in your colours.
Live data
Every chart is the Homies Stats series — 2011 to September 2026, updated with each release.
The real month
Seasonally adjusted numbers alongside the headline, so you can say what actually changed.
Prompt library
Make this report yours — branded, for your market
Everything on this page comes from a public feed any Homie can read. Copy the prompt, paste it into Homies (or any AI with web access) and answer five questions: your market, your audience, your brand, whether to gate the full report behind a lead-capture form, and whether you want an Instagram carousel or story to promote it. It writes a report like this one for your farm area — your logo in the header, your colours on the headings and on the live charts, your headshot and call to action at the end, your brokerage disclaimer in the footer — with this month’s real numbers and nothing invented.
- 1
Copy the prompt
Hit copy — it's complete, nothing to fill in first.
- 2
Paste it into Homies
Or any AI with web access. It asks five questions, then waits.
- 3
Bring your brand
Logo, colours, headshot, brokerage, CTA, disclaimer. The charts take your colours too.
- 4
Review, then publish
It writes the report with live charts and stops for your approval before anything goes out.
Want to see what branded charts look like before you run it? Add your brokerage’s palette to any chart on this page — RE/MAX , Royal LePage , eXp — or your own hex codes with &colors=0B2545,C9A227.
September 2026
Buyers sat on their hands in September
GTA REALTORS® reported 5,040 salesthrough TRREB’s MLS® System in September 2026, down 9.0 per cent from September 2025. New listings fell even harder — 16,500, down 14.4 per cent. The average selling price was $1,006,409, down 5.1 per cent year over year, and the MLS® Home Price Index composite benchmark was down 4.7 per cent. TRREB put it down to uncertainty — about the economy, inflation and borrowing costs — keeping would-be buyers on the sidelines, with the October 26 municipal elections adding a policy question mark on top.
Sales
5,040
−9.0% yr/yr · −5.2% m/m (SA)
Average price
$1,006,409
−5.1% yr/yr · −2.3% m/m (SA)
Median price
$860,000
−5.4% yr/yr
New listings
16,500
−14.4% yr/yr · −3.8% m/m (SA)
Active listings
26,131
−11.1% yr/yr · 4.6 months of inventory
MLS® HPI composite
$917,600
−4.7% yr/yr · −0.5% m/m (SA)
Year to date, the picture is steadier than any single month suggests: 47,115 sales through September is only 1.0 per cent behind 2025’s pace, while new listings are down 15.0 per cent and the year-to-date average price is down 4.8 per cent to $1,025,266. Fewer homes are coming to market, roughly the same number are selling, and prices are drifting lower rather than falling off a ledge.
Seasonally adjusted
Strip out the calendar and September got worse
Raw month-to-month comparisons in real estate are mostly the calendar talking — September always brings a wave of new listings after the summer lull. TRREB’s seasonally adjusted series remove that. On that basis, sales fell 5.2 per cent from August to 5,174, tied with February for the second-biggest monthly drop of the past year. New listings fell 3.8 per cent. The adjusted MLS® HPI slipped 0.5 per cent to $924,600, handing back the small gains from June and July.
| Month | Sales | Avg. price | New listings | MLS® HPI |
|---|---|---|---|---|
| Sep 2025 | 5,655 | $1,060,854 | 15,318 | $971,000 |
| Jun 2026 | 5,383 | $1,021,088 | 12,962 | $929,400 |
| Jul 2026 | 5,537 | $1,014,565 | 12,798 | $930,800 |
| Aug 2026 | 5,459 | $1,029,503 | 13,455 | $929,200 |
| Sep 2026 | 5,174 | $1,006,305 | 12,939 | $924,600 |
Source: TRREB Market Watch news release, September 2026 (seasonally adjusted table). Full 13-month series in the chart above and at homiesai.com/stats.
The ratio of adjusted sales to adjusted new listings was 40.0 per cent in September — barely changed from August’s 40.6 per cent and actually tighter than the 36.9 per cent of a year ago, because sellers have retreated even faster than buyers. That puts the GTA right at the edge of buyer’s-market territory (below 40 per cent), not deep inside it.
Prices
Back over $1 million — on paper
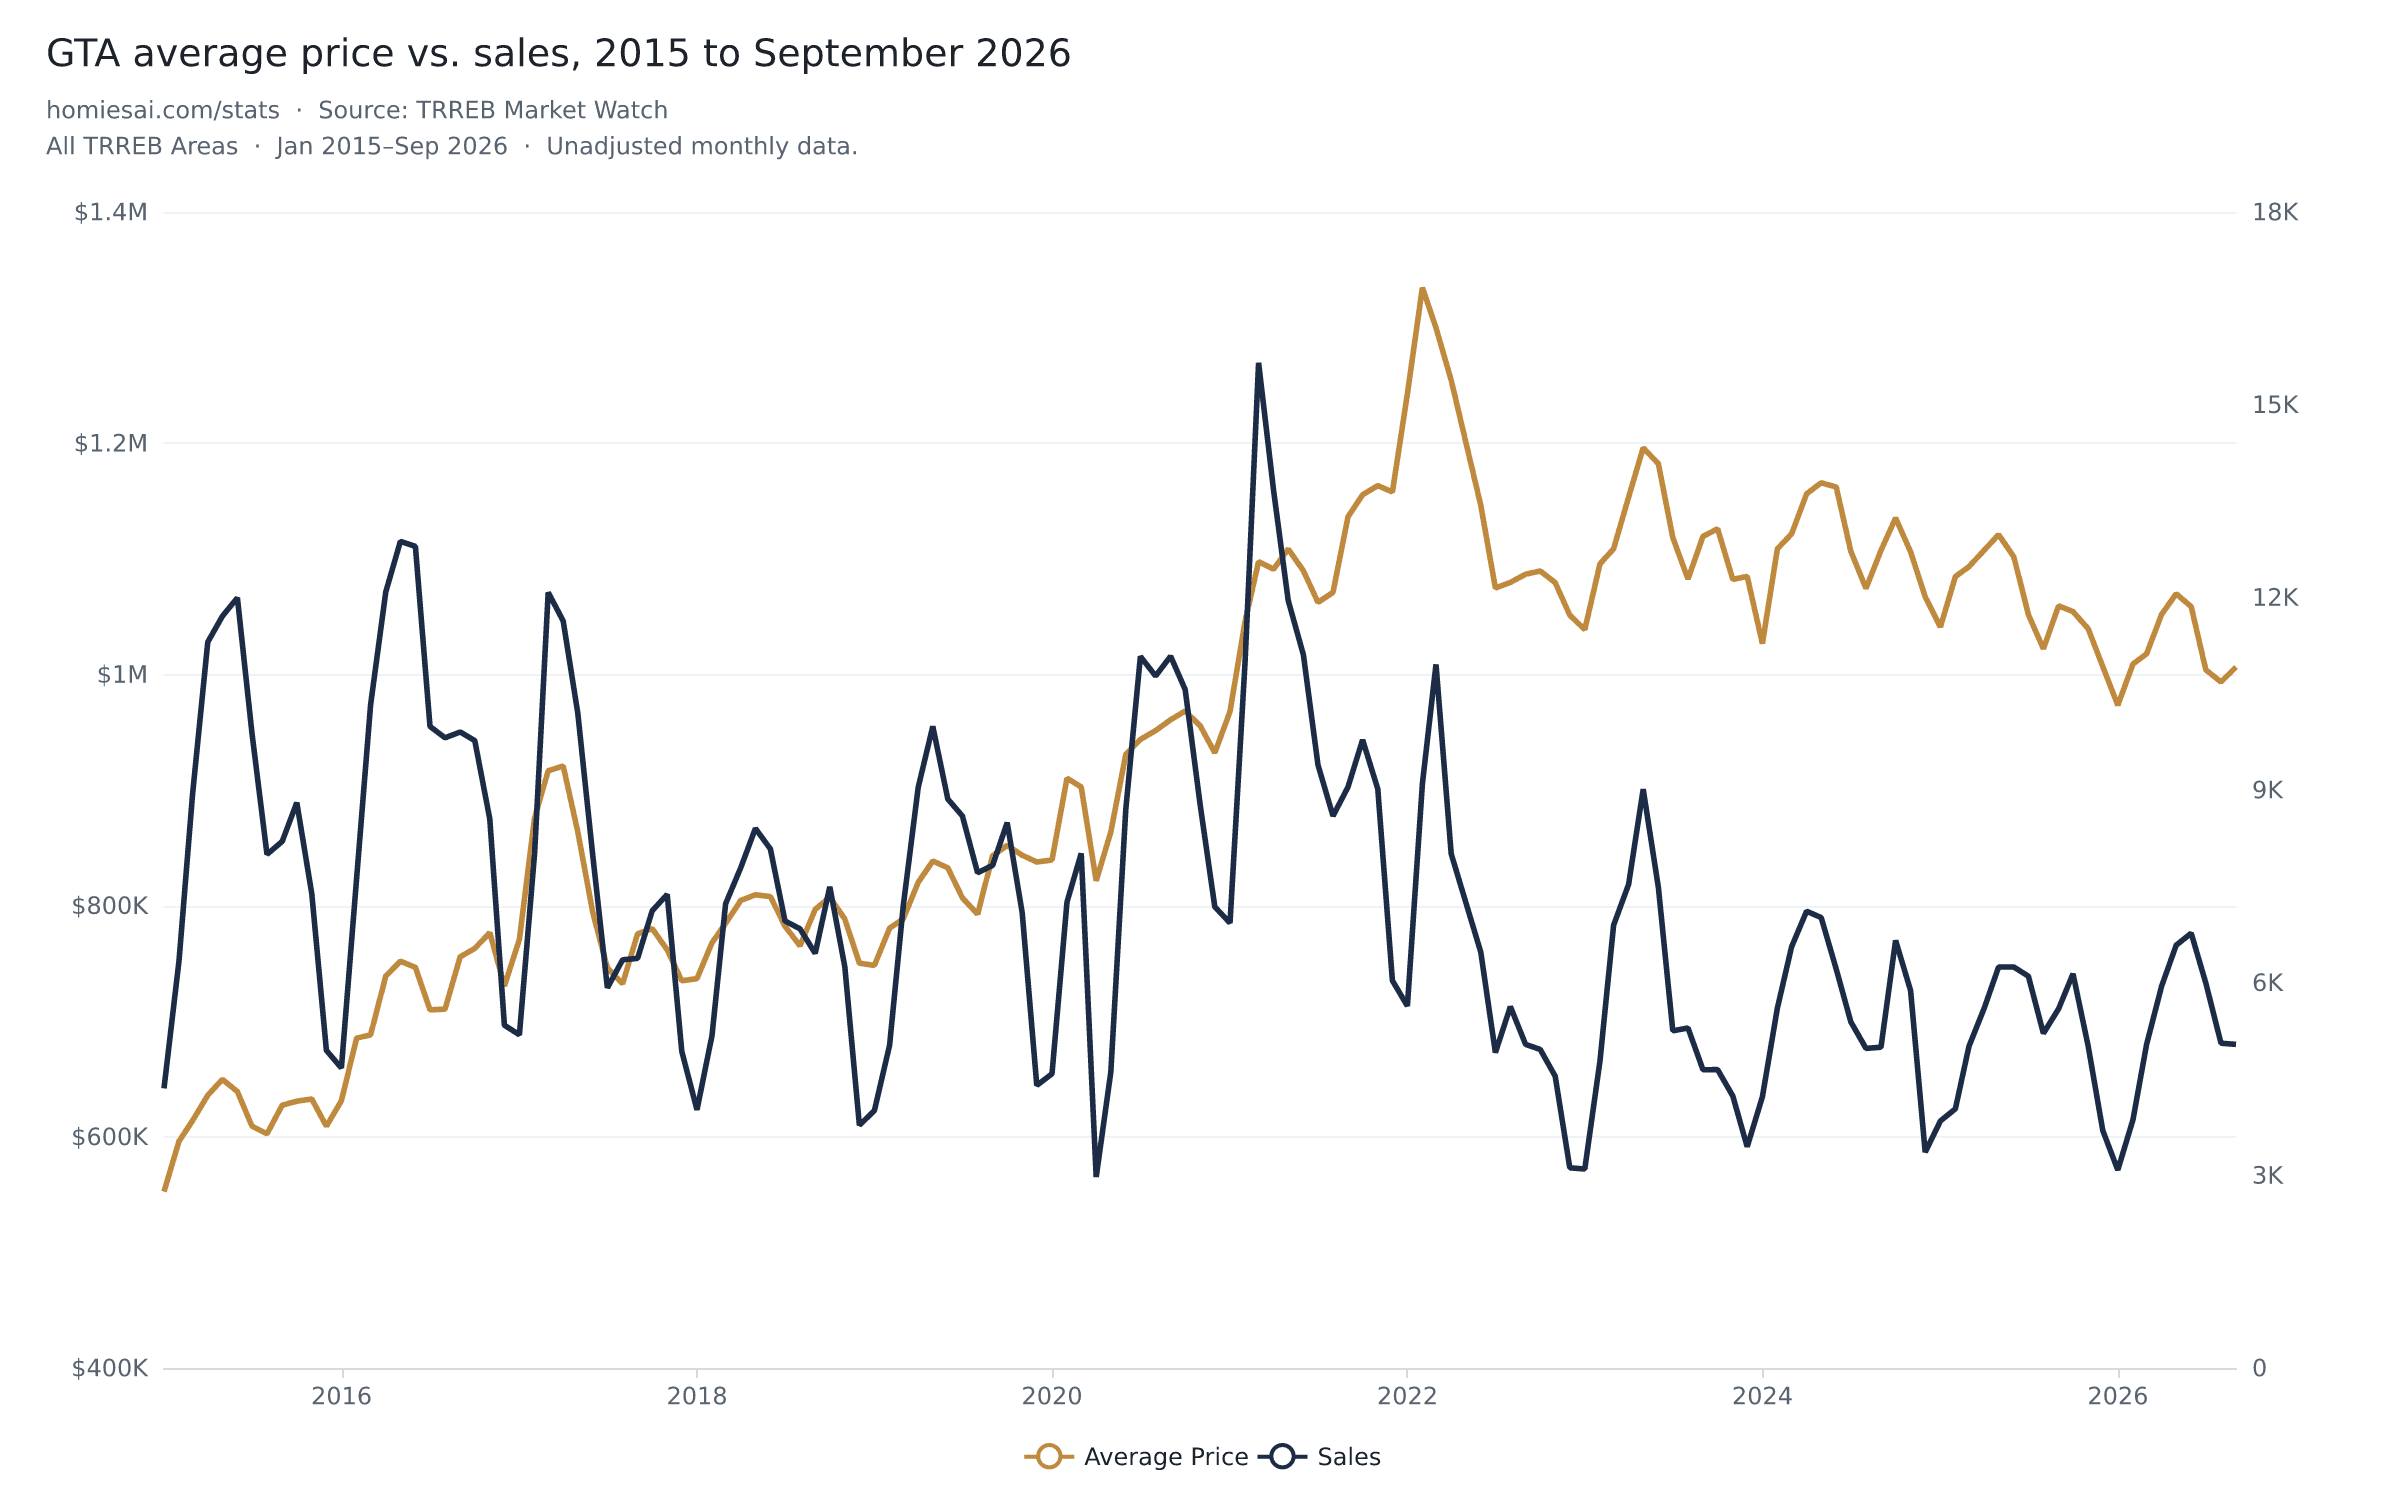
The unadjusted average rose 1.3 per cent from August’s $993,410 to cross $1 million again. Don’t read that as a recovery: it’s mostly mix, as more detached homes trade in September. Seasonally adjusted, the average price fell 2.3 per cent to $1,006,305 — its largest monthly decline since January — and the benchmark, which prices the same typical home every month, kept edging lower. At $1,006,409 the average sits 24.6 per cent below the February 2022 peak of $1,334,544.
Zoom out and the trend is a slow grind, not a crash. Drag across the chart to zoom into any window:
416 vs. 905
The suburbs lost more sales — and many more listings
In the City of Toronto, sales fell 5.4 per cent to 1,937 at an average of $1,034,320 (−5.2 per cent). In the rest of the GTA, sales fell twice as fast — 11.2 per cent to 3,103 — at an average of $988,986 (−5.1 per cent). The bigger gap is on the supply side: 905 sellers listed 17.4 per cent fewer homes than a year ago, against 9.3 per cent fewer in the 416. Price-wise, the two halves of the market are falling in lockstep.
Home types
Condos are still doing the falling
Every home type sold less than a year ago, and every type was cheaper. Condo apartments led the price decline at −7.7 per cent board-wide, and −12.0 per cent in the 905, where they averaged $533,654. Detached homes fell 5.1 per cent to $1,292,016 — 7.6 per cent in the 416. Semi-detached homes were the exception: essentially flat at −0.2 per cent, and up 2.1 per cent inside Toronto, the only gain anywhere in the release.
| Type | Sales | YoY | Avg. price | YoY |
|---|---|---|---|---|
| Detached | 2,399 | −8.7% | $1,292,016 | −5.1% |
| Semi-detached | 459 | −8.2% | $1,015,202 | −0.2% |
| Townhouse | 803 | −12.8% | $820,637 | −4.6% |
| Condo apartment | 1,316 | −7.8% | $605,257 | −7.7% |
Source: TRREB Market Watch news release, September 2026. Townhouse combines attached/row and condo townhouses, as in the release.
Benchmark by region
York Region and South Simcoe are falling fastest
The MLS® HPI strips out the mix of what sold, so it’s the better guide to what a typical home is worth. Every region and every housing type posted a year-over-year decline. South Simcoe County (−7.2 per cent) and York Region (−6.5 per cent) led the composite down, while Orangeville (−2.6 per cent) and Halton (−3.4 per cent) held up best. Apartments are the weak spot everywhere — down 13.7 per cent in South Simcoe and 11.9 per cent in Orangeville.
| Region | Composite | Detached | Townhouse | Apartment |
|---|---|---|---|---|
| All TRREB Areas | −4.7% | −4.8% | −6.5% | −6.7% |
| Halton Region | −3.4% | −3.6% | −7.4% | −5.1% |
| Peel Region | −4.8% | −5.5% | −6.8% | −8.1% |
| City of Toronto | −3.8% | −4.5% | −5.0% | −6.4% |
| York Region | −6.5% | −6.4% | −7.0% | −8.8% |
| Durham Region | −5.2% | −5.1% | −7.5% | −7.7% |
| Orangeville | −2.6% | −1.2% | −9.0% | −11.9% |
| South Simcoe County | −7.2% | −6.8% | −6.2% | −13.7% |
Source: TRREB Market Watch news release, September 2026. Single-family attached omitted for width (All TRREB Areas −4.8%).
Supply
Sellers are still the ones stepping back
New listings were down 14.4 per cent year over year — the eighth straight month in which listings fell faster than sales — and active listings ended September at 26,131, down 11.1 per cent. That is the cushion under prices: owners who don’t need to sell aren’t listing into a soft market. The sales-to-new-listings trend ticked up to 37.8 per cent (34.6 per cent a year ago) and months of inventory held at 4.6 — balanced-to-soft, not a glut. Homes took 34 days to sell and closed at 98 per cent of asking.
The rate backdrop hasn’t moved: the Bank of Canada’s overnight rate held at 2.25 per cent through September, and the posted five-year rate at 6.09 per cent. This market is waiting on confidence, not on cheaper money.
Your farm
Three months of inventory in Whitby, eleven in King
Board-wide averages hide how different the GTA’s towns are right now. In Whitby and Ajax, about 45 per cent of new listings are selling and inventory is around three months — the tight end of balanced. In King, there are 11.4 months of inventory; Innisfil and Georgina sit above six. Toronto East homes sold over asking on average (101 per cent of list), while Georgina and King closed at 94 per cent.
| Area | Avg. price | SNLR (trend) | Months inv. | SP/LP | Days |
|---|---|---|---|---|---|
| Whitby | $882,772 | 44.6% | 2.9 | 99% | 24 |
| Ajax | $828,835 | 44.8% | 3.0 | 99% | 25 |
| Toronto East | $956,004 | 41.8% | 3.6 | 101% | 29 |
| Markham | $1,125,353 | 40.5% | 4.1 | 98% | 34 |
| Mississauga | $929,600 | 36.5% | 4.8 | 97% | 36 |
| Toronto Central | $1,102,955 | 36.4% | 5.1 | 98% | 34 |
| Richmond Hill | $1,189,203 | 33.3% | 5.6 | 98% | 36 |
| Georgina | $873,859 | 28.5% | 6.5 | 94% | 46 |
| Innisfil | $747,652 | 27.1% | 7.3 | 97% | 44 |
| King | $1,875,750 | 21.8% | 11.4 | 94% | 42 |
Source: TRREB Market Watch, September 2026. SNLR and months of inventory are TRREB trend measures. Every region and municipality is in the explorer.
On camera
The full chart set, in running order
The eight visuals for this month’s market video, in the order they’re narrated, each with the number to say while it’s on screen. Every chart is live, so scroll it top to bottom on screen share, or open any one full screen.
Seasonally adjusted sales vs. new listings — the thesis chart
SA sales 5,174 (−5.2% m/m) · SA new listings 12,939 (−3.8%)
Strip out the calendar and September was a step back on both sides — buyers more than sellers.
Average price vs. benchmark, seasonally adjusted
SA average $1,006,305 (−2.3%) · SA HPI $924,600 (−0.5%)
The headline went back over a million. Adjusted for the season, it actually fell the most since January.
Sales and new listings, year over year
Sales −9.0% · new listings −14.4%
Sellers are still pulling back harder than buyers. That's the cushion under prices.
City of Toronto vs. the whole board, average price YoY
416 −5.2% · GTA −5.1%
For once the 416 and the 905 are falling at exactly the same speed.
Average price by home type, year over year
Condo apt −7.7% · detached −5.1% · semi −0.2%
Condos are still doing the falling. Semis are the one type that's basically flat.
Fifteen years of average price and sales
$1,006,409 · 24.6% below the February 2022 peak
Zoom out: this is a slow grind lower, not a crash — and it's been the same story for three years.
Sales-to-new-listings ratio, trend
37.8% (trend) · 34.6% a year ago · 4.6 months of inventory
Below 40% is buyer territory. We're sitting just under the line — tighter than a year ago, not tight.
Months of inventory, every region and municipality
Whitby 2.9 months · King 11.4 months
Same board, same month: one town is a seller's market and another has almost a year of supply. Know your farm.
Method
Method & sources
Figures are from the Toronto Regional Real Estate Board’s Market Watch for September 2026 and its news release (both published October 6, 2026), including the release’s seasonally adjusted table and MLS® HPI summary. Charts are live embeds of the Homies Stats TRREB explorer , which parses every Market Watch back to 2011 into machine-readable series — 41 regions and municipalities, five home types. The seasonally adjusted series (sales_sa, ap_sa, nl_sa, hpi_sa) are new to the feed this month and grow with each release. TRREB’s year-over-year changes compare against a revised September 2025 (5,540 sales, $1,060,036 average), while the charts plot earlier months as first reported, so chart-computed changes can differ from the release by a fraction of a point. Active-listing and median changes in this article compare against September 2025 as first published.
Planning and legal notice
TRREB® and Market Watch are trademarks of the Toronto Regional Real Estate Board. MLS® and the MLS® HPI are trademarks of The Canadian Real Estate Association. This independent analysis is not affiliated with or endorsed by TRREB. Data is provided for information, not as investment advice.