AI market reports for realtors, built from live Canadian real estate stats.
Stop screenshotting last month's PDF. One prompt turns the latest CREA, TRREB and Bank of Canada data into a branded, interactive market report for any market in Canada — with a lead-capture gate and Instagram assets if you want them.
Live data
104 CREA markets, 41 GTA municipalities and 222 economic series, loaded the day each release drops. Free, no API key.
Interactive
Charts you can hover and zoom, embedded in your report — not images of charts.
One prompt
Copy, paste into Homies, answer four questions. The report, the email and the carousel come back for approval.
Definition
What an AI market report is — and what it isn't
Every realtor sends a market update. Most are built the same way: wait for the board PDF, screenshot two charts, drop them into a template, write three paragraphs that could have been written last month, and send. Market report software automates the template step and charges a subscription for it, but the output is the same object — a static page or PDF of last month’s numbers that every agent on the platform is also sending.
An AI market reportstarts from the other end. An assistant reads the live data feed for your market — the CREA release that came out this morning, the TRREB Market Watch from last week, the Bank of Canada’s current rate — computes the year-over-year changes itself, writes the narrative for the audience you name, and embeds charts that readers can hover and zoom. The report is different for a first-time buyer in Halifax than for an investor in Calgary, because you told it who it was for. It takes about four minutes, and the data underneath it is free.
This guide shows a finished one, walks through the Canadian real estate stats it draws on, compares it honestly with the software category, and gives you the prompt.
Worked example
A finished one: Canada, August 2026
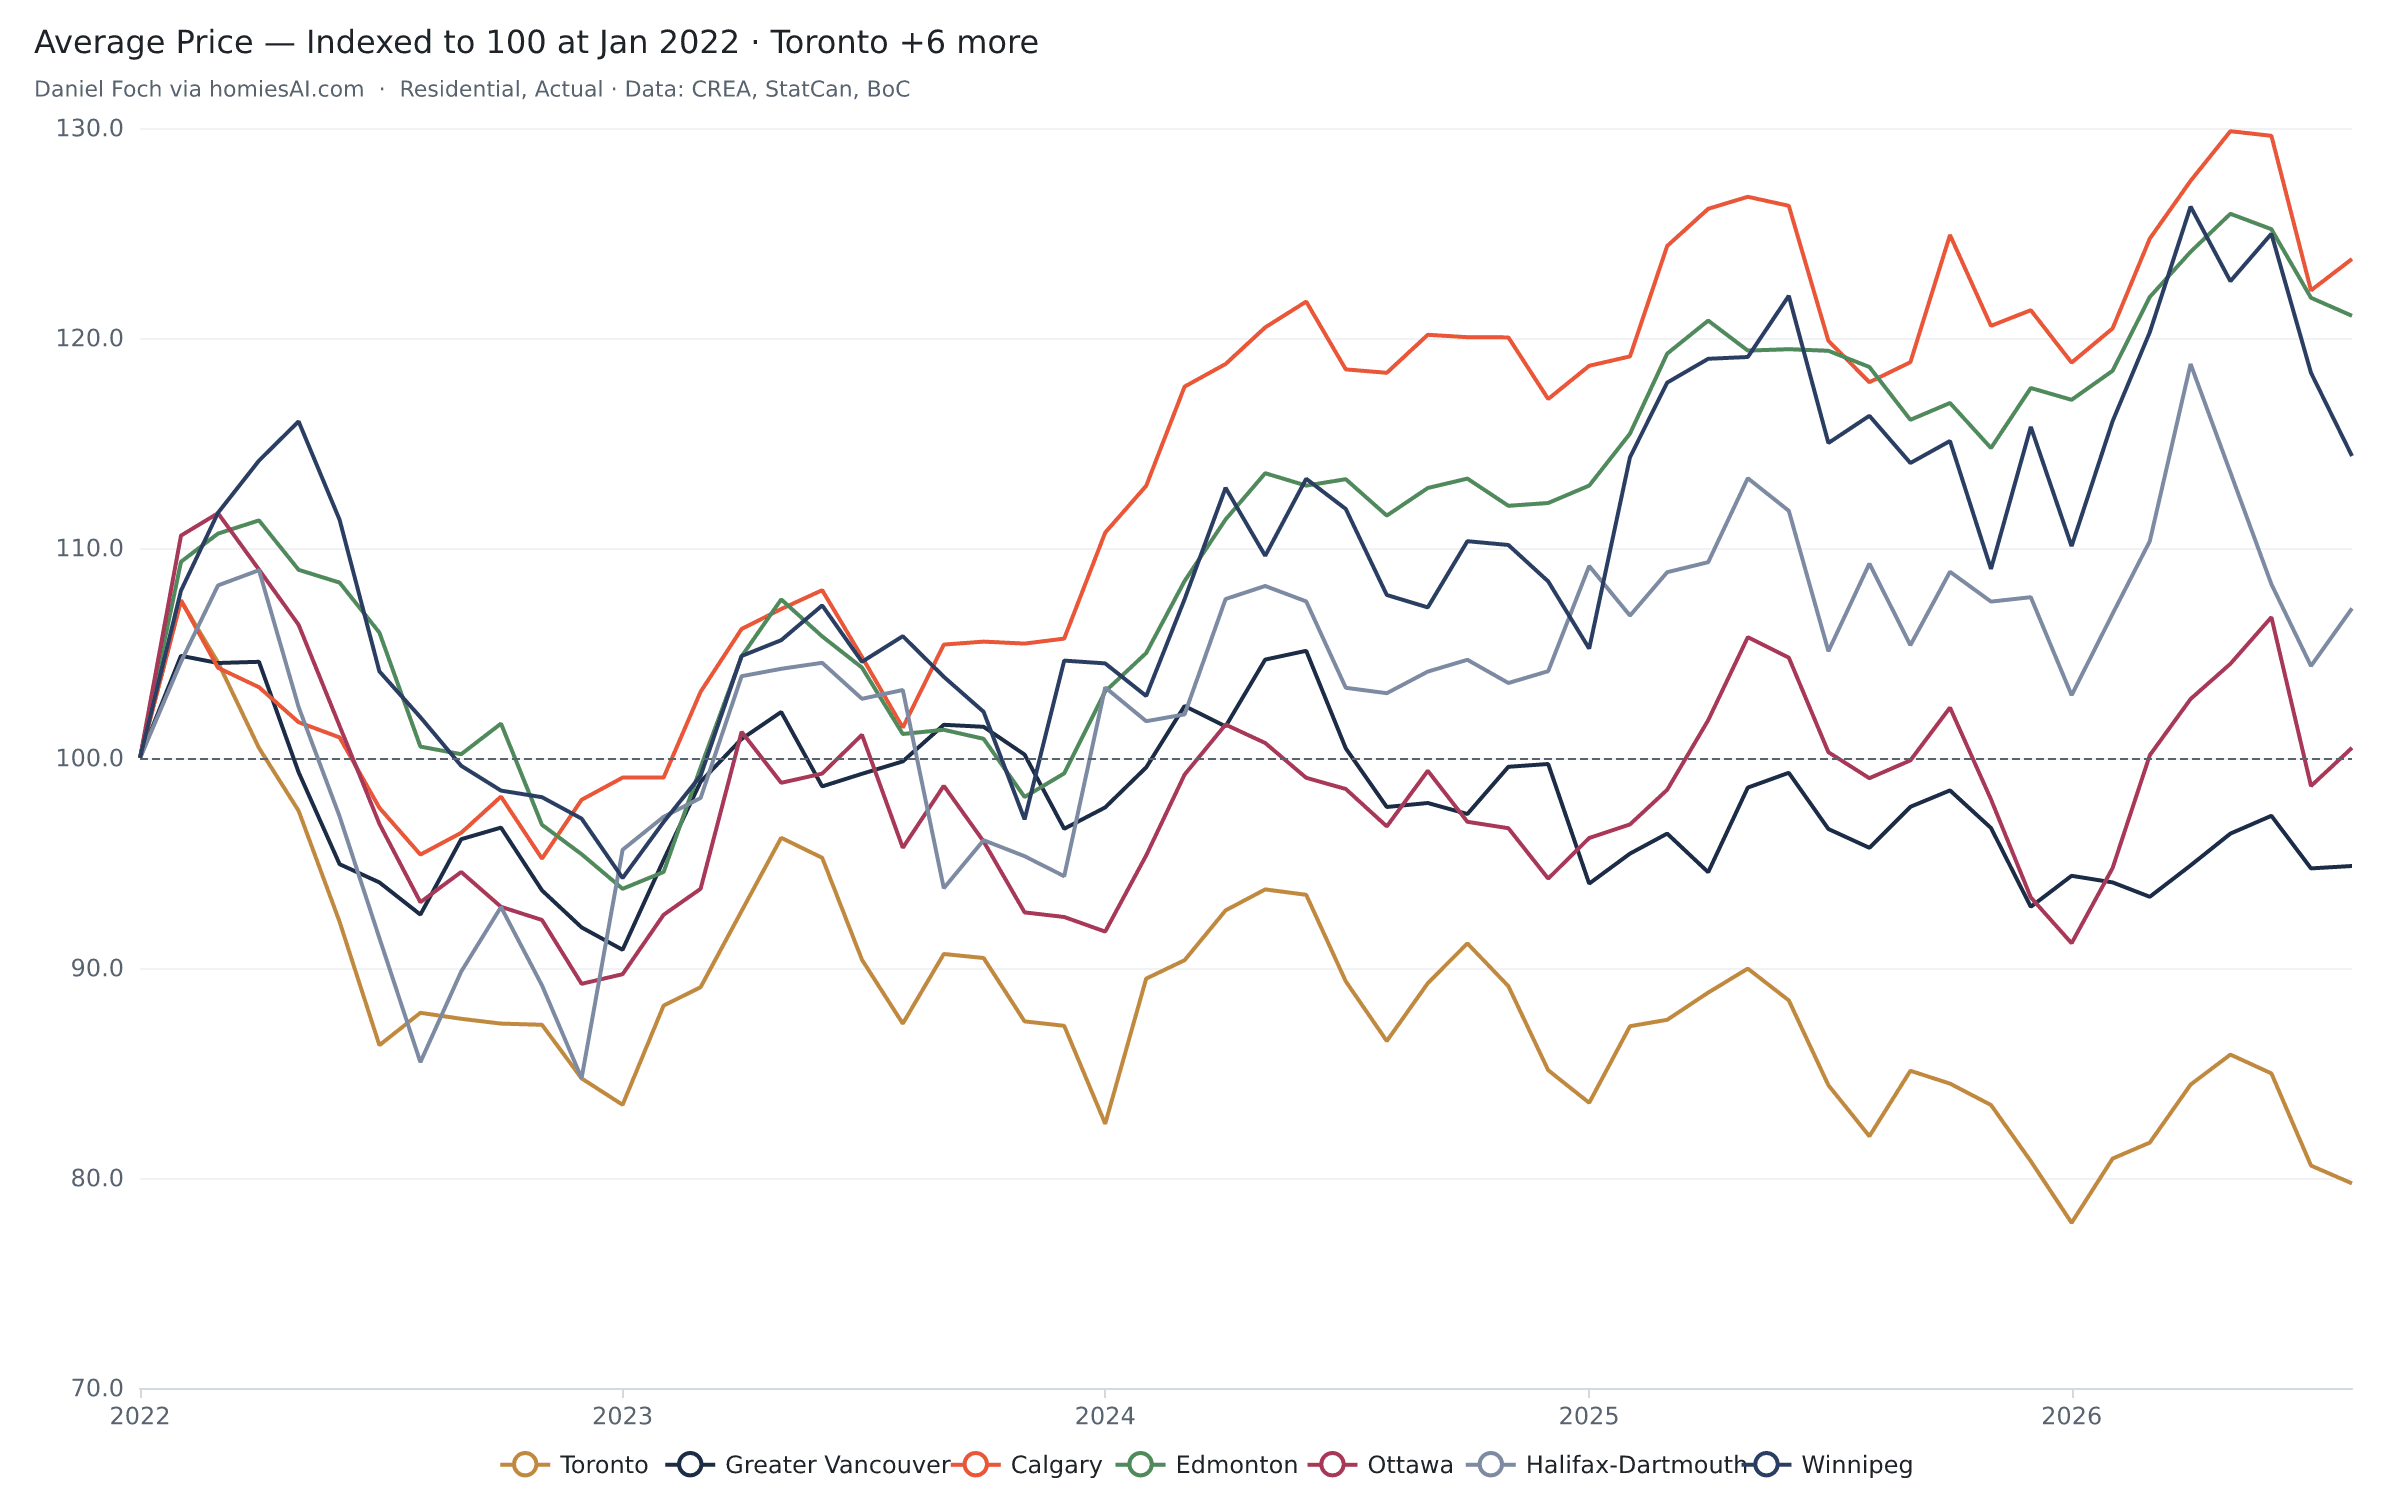
CREA published its August statistics on September 15. The same morning, the release was in the feed and this report was live: Two Canadas, in charts you can touch . Eleven charts, each with the stat to notice and the line to say. Three of them are embedded here — they are the actual live views, not screenshots, so what you see is current as you read this.
Provinces, indexed to January 2022
Ontario 78 · Alberta 118 · New Brunswick 132 · Newfoundland 137
The single chart every Canadian buyer should see before reading a national headline. Drag the brush to zoom.
Sales and new listings on one chart
Sales −7% yr/yr · listings −3% · ratio 49.1%
Two measures, two axes, tooltips on hover — the kind of chart a PDF cannot be.
Sales against the 5-year mortgage rate, inverted
Posted 5-year 6.09% · overnight 2.25%
Housing data next to Bank of Canada data on the same timeline, from the same feed.
The GTA version — built from TRREB’s Market Watch with municipality-level detail and home-type splits — is here: Toronto’s August, in charts you can touch . Both pages carry the prompt that produced them.
The feed
The Canadian real estate stats underneath
The reports draw on Homies Stats, a public housing-data feed we maintain for the Homies AI team and for any realtor who wants it. Every series is plain JSON with no API key, refreshed on release day, and rendered on demand as interactive embeds or brandable chart images. It is, as far as we know, the most complete free set of Canadian housing statistics available in one place:
CREA board statistics
104 markets — 91 real estate boards, 12 provinces and territories, and the national series — monthly average price, sales, new and active listings, sales-to-new-listings ratio and months of inventory. Boards reach back to 1980; the national average price series starts in 1993.
TRREB Market Watch
41 GTA regions and municipalities, five home types, every month since 2011 — plus the MLS® HPI composite benchmark — parsed from every Market Watch release.
Bank of Canada & StatCan
222 macro series: policy and mortgage rates, CPI and its components, the Labour Force Survey, EI claims, GDP by industry, population and migration, mortgage originations and the variable-rate share.
CMHC, OSB and the LTB
Housing starts, rents and vacancy by CMA; consumer insolvencies; and Ontario Landlord and Tenant Board order counts — the datasets a market report usually has to skip.
Because the housing and macro series share one timeline, a report can put your board’s sales next to the 5-year mortgage rate, or a province’s prices next to its unemployment rate, without exporting anything. Explore it directly at homiesai.com/stats , or hand the feed to any AI with the housing-data prompt .
Comparison
Market report software vs. a prompt
The software category is not bad; it is built for a world where the data arrived as a PDF once a month and charts were images. Here is where the two approaches actually differ:
| Typical market report software | AI market report in Homies | |
|---|---|---|
| Data freshness | Last month's numbers, refreshed on the vendor's schedule | Loaded the day CREA and TRREB publish — the August release was live within hours |
| Charts | Static images in a PDF or a templated page | Live embeds: hover for values, zoom any window, toggle series |
| Coverage | Your board, sometimes your province | Every Canadian board, province, GTA municipality and home type, plus rates and inflation on the same timeline |
| Branding | Logo and colours in a fixed template | Your name, brokerage and palette on every chart; the report reads in your voice for your audience |
| Lead capture | Usually a separate tool | A gated preview with the Homies lead-capture form built in |
| Social | Not included | Instagram carousel or story generated from the same charts, staged for approval |
| Cost | A monthly subscription | The data and charts are free; the report is one prompt in Homies |
The honest caveat: an AI report is only as good as the feed and the prompt behind it. That is why the prompt below names its data sources by endpoint, forbids invented numbers, and requires the live embeds rather than letting the assistant draw its own charts — every rule in it was added after a real run went wrong.
The prompt
How to make one in four minutes
The prompt is complete. It carries the route map for every Canadian market, the data endpoints, the embed recipes, the two-tier lead funnel and the Instagram steps. The walkthrough below runs the GTA version end to end; the national version is the same flow with a different market.
- 1
Copy the prompt
It's complete — market list, data endpoints, chart embeds, funnel and social steps are all in it.
- 2
Paste it into Homies
Or any AI assistant with web access. It fetches the live feed, then asks four questions and waits.
- 3
Answer four questions
Your market, your audience, open or gated, and whether you want Instagram assets.
- 4
Review, then publish
You get the report with live charts, the email teaser and the social assets — nothing is sent or posted until you say so.
Timing
When Canadian housing stats come out
A market report is only current if it is sent after the data lands. These are the releases that move the feed; build your sending schedule around them.
CREA national statistics
Around the 15th of each month
The next package is scheduled for October 16, 2026.
TRREB Market Watch
The first week of each month
August's release came September 3.
Bank of Canada rate decisions
Eight scheduled dates a year
Announcements move the mortgage-rate series the same day.
Statistics Canada CPI
Mid-month
Feeds the inflation series and the real-rate story.
Labour Force Survey
Early each month
Employment and unemployment by province, the demand-side backdrop.
Questions
Frequently asked
What is an AI market report for real estate?
A market report written and assembled by an AI assistant from a live housing-data feed rather than from a template and last month's PDF. In Homies, one prompt pulls the latest CREA, TRREB and Bank of Canada figures for your market, writes the narrative for your audience, embeds interactive charts, and can add a lead-capture gate and Instagram assets.
Is the Canadian real estate data free?
Yes. Homies Stats serves every series as plain JSON with no API key — 104 CREA markets, 41 TRREB regions, and 222 macro series — plus rendered chart images you can brand with a credit line. Board-level figures remain subject to CREA's data licensing for republication.
Which markets are covered?
All of Canada at the board level (91 boards), every province and territory, the national series, and the Greater Toronto Area by municipality and home type. If you can name the board, the prompt can build the report.
How is this different from market report software?
Market report software typically renders last month's numbers into a fixed template as a static PDF or page, for a monthly subscription. An AI market report is generated on request from live data, uses interactive charts, and is tailored to a specific audience — first-time buyers, investors, sellers — in your own voice.
Can I brand the charts?
Yes. Every embed carries your credit line, and the chart-image API accepts a credit parameter and a palette so social assets match your brokerage colours.
Does it capture leads?
If you choose the two-tier option, the prompt publishes a public preview — roughly the first 30% of the report — ending in a sign-up box built with the Homies lead-capture form. Leads land in your Homies warehouse before the full report is revealed.
Planning and legal notice
Data sourced from CREA aggregate statistics, TRREB Market Watch, the Bank of Canada and Statistics Canada, visualized by Homies Stats — an independent tool not affiliated with or endorsed by CREA or TRREB. MLS® and the associated logos are trademarks of the Canadian Real Estate Association. Information, not investment advice.