The inventory turn, in charts you can touch.
CREA's full August data package landed this week — active listings, all 92 boards and property types, none of which were in Tuesday's press release. The story it carries: homes for sale are now falling in the provinces that have too many and rising in the ones that have too few. Ten live charts, plus the prompt that rebuilds it for your market.
New this week
Active listings, every board and property-type medians arrived with the full package on September 18. The press release carries none of them.
Ten charts
Inventory against its pre-pandemic level, the buyer's-or-seller's split, every market ranked, and detached against condo. Nothing is a screenshot.
Yours
Prompt v2 adds inventory, a market-balance call and property types for any province or board — with the optional lead funnel and Instagram assets.
Prompt library
Make your own version of this report
Every chart on this page is a live view of the same feed any Homie can read. Copy the prompt, paste it into Homies (or any AI with web access), and answer four questions — your market, your audience, whether to gate the full report behind a lead-capture form, and whether you want an Instagram carousel or story. Version 2 does what this page does for your market: it measures homes for sale against 2019, calls the market buyer’s, balanced or seller’s from the seasonally adjusted ratio, breaks out detached, townhouse and condo medians where CREA publishes them, and closes with what to tell sellers and buyers. New to the idea? Start with the guide to AI market reports for realtors .
- 1
Copy the prompt
Hit copy below — it's complete, nothing to fill in first.
- 2
Paste it into Homies
Or any AI with web access. It asks four questions, then waits for you.
- 3
Answer four questions
Market, audience, gated or open, and whether you want Instagram assets. Silence takes the defaults.
- 4
Review, then publish
It writes the report with these same live charts and stops for your approval before anything is sent or posted.
September 18, 2026
What the full package adds
CREA publishes in two steps. The press release on the 15th carries the national numbers and a table of about thirty markets — sales, prices, new listings. That was Tuesday’s report : sales down 6.9 per cent, an average price of $668,219, and a country split in two on price. The full data package follows a few days later, and it holds what the release leaves out: active listings for every market, the other seventy-odd boards, seasonally adjusted series at the board level, and median prices and days on market by property type. It loaded into the feed this morning. Every price and sales figure from Tuesday was confirmed to the dollar; what follows is everything Tuesday could not show.
Homes for sale
199,943
+1.4% yr/yr · the most for any August since 2019
Ontario inventory
−3.9% yr/yr
sixth straight decline · it was +18.1% a year ago
Quebec inventory
+18.8% yr/yr
it was −2.1% a year ago · Manitoba +16.9% · Nova Scotia +13.6%
Buyer's markets
35 of 92 boards
30 of them in Ontario · ratio under 45%, seasonally adjusted
Seller's markets
22 of 92 boards
down from 27 a year ago · none in Southern Ontario or the Lower Mainland
Days on market
Longer in 21 of 28
large boards against last August · Edmonton 29 days vs 25
Tuesday’s thesis was “two Canadas”: Ontario and British Columbia still repairing, everyone else above their 2022 prices. The inventory data says the same thing about levels — and the opposite about direction.
Supply
The inventory turn
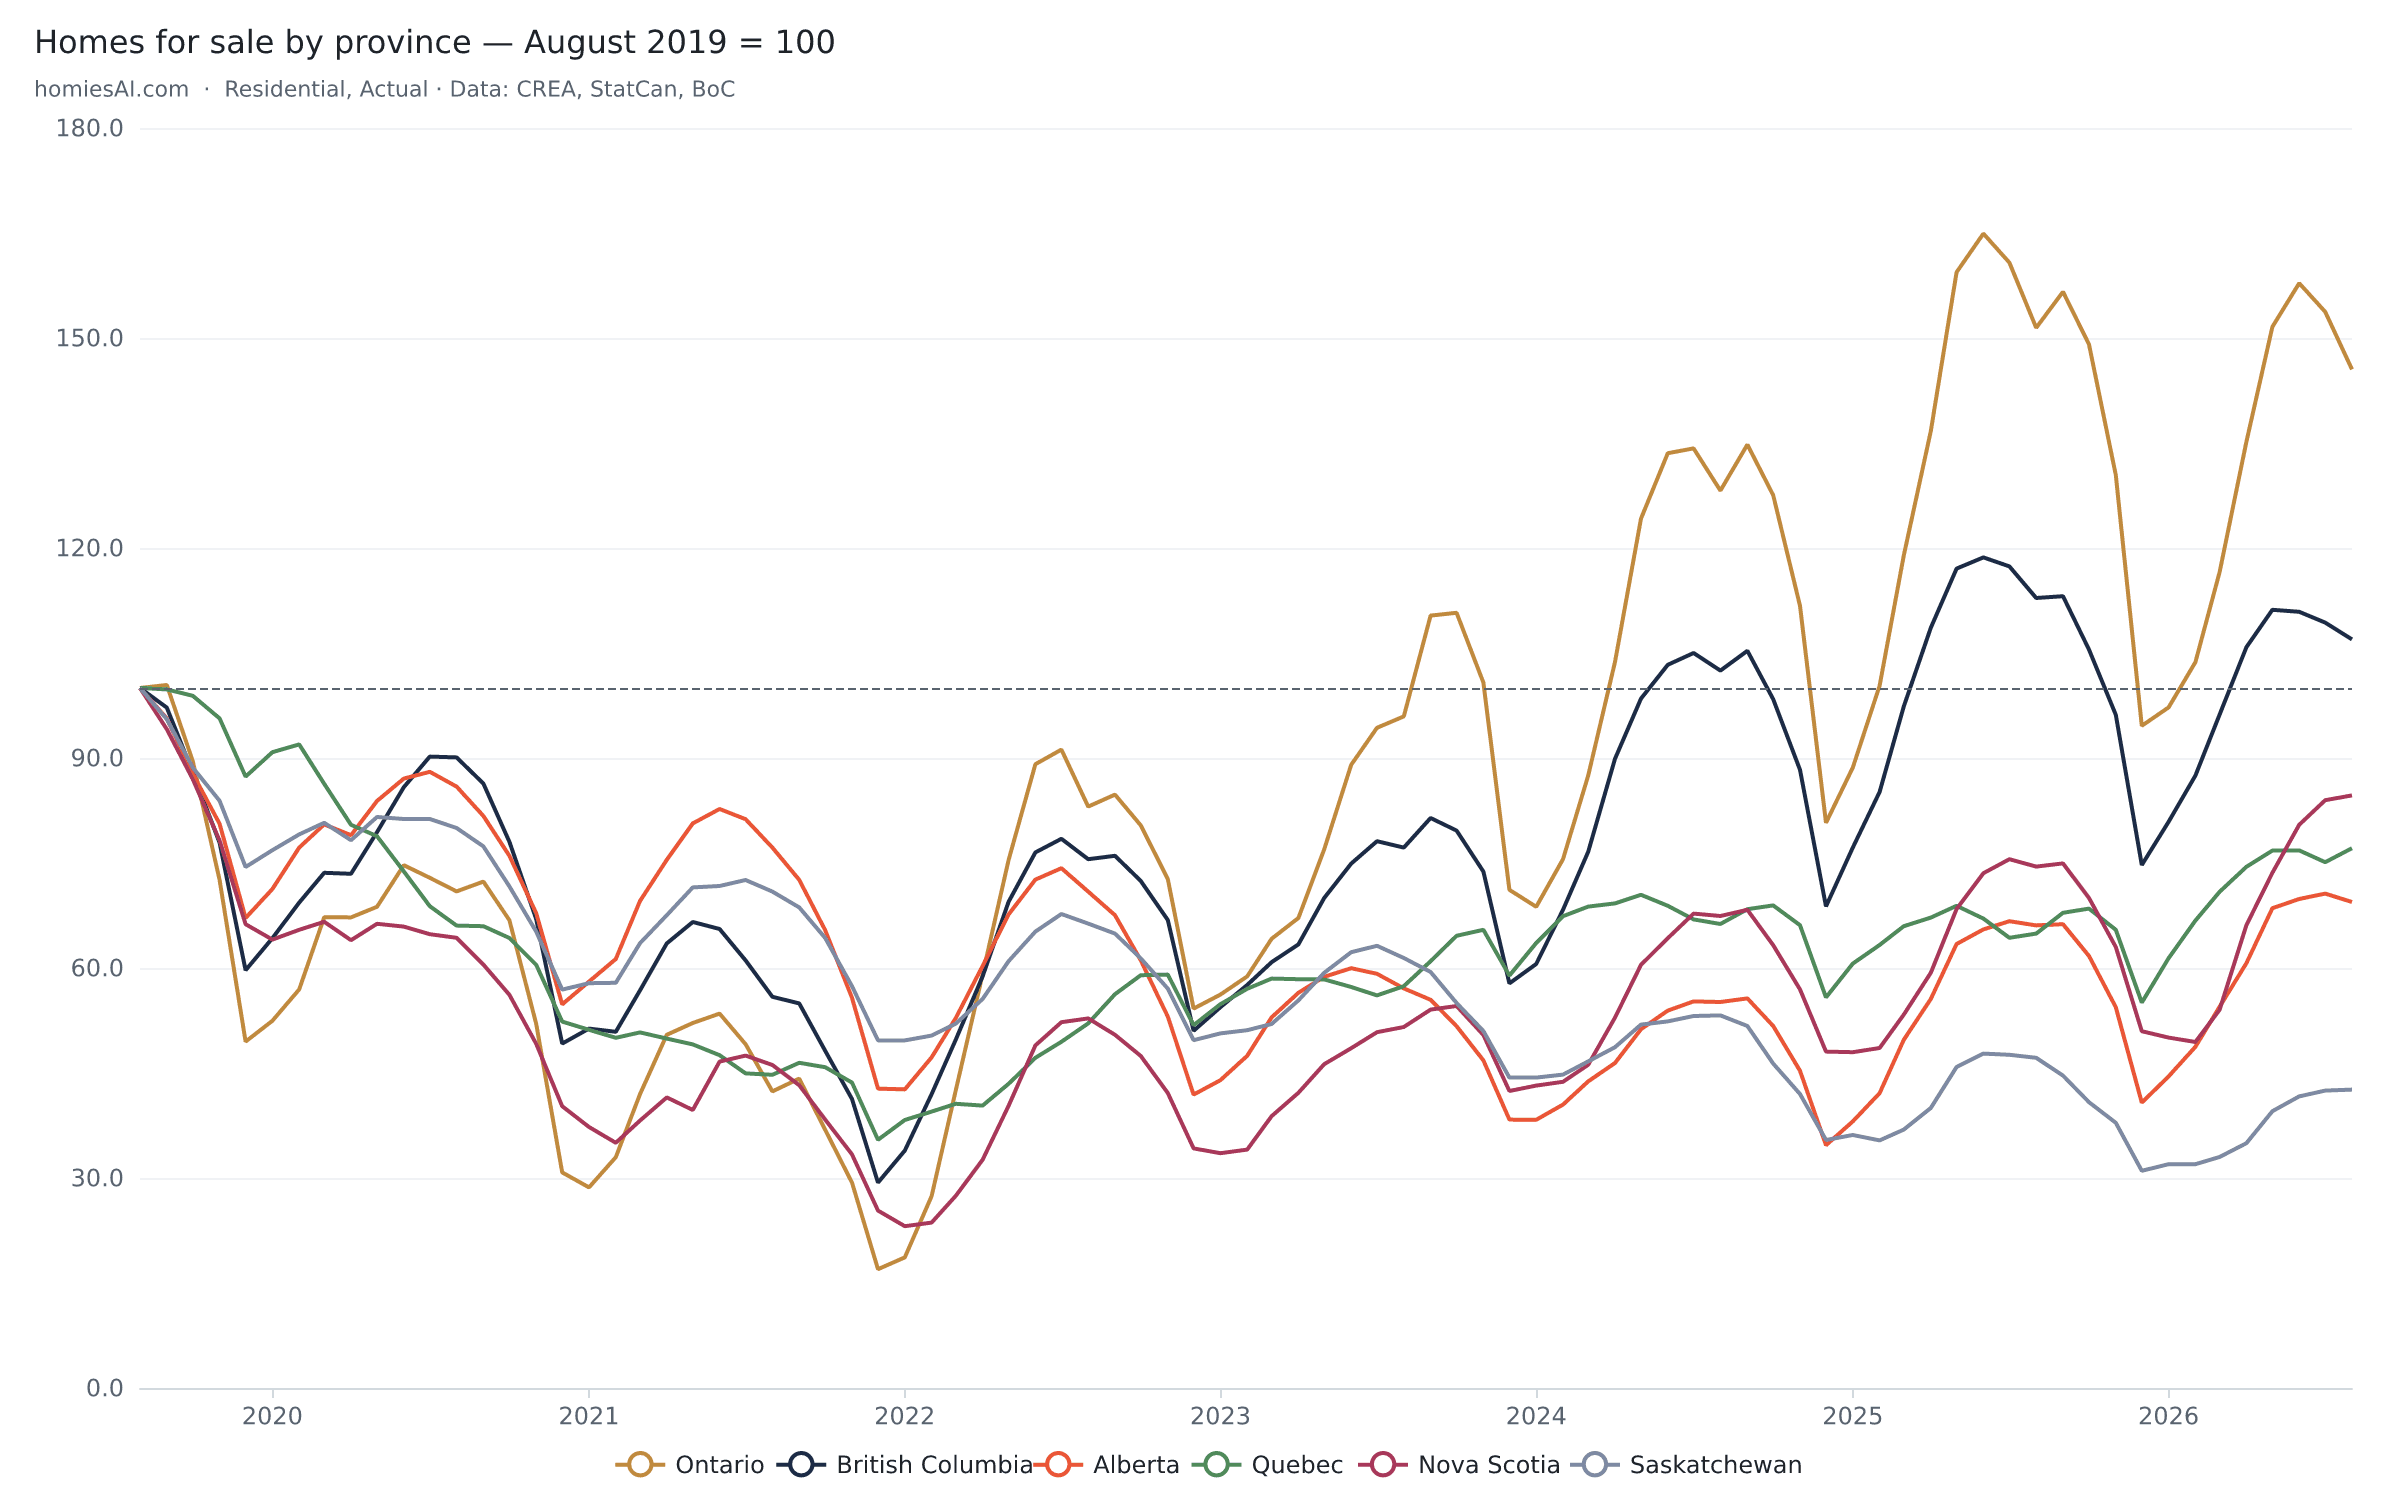
There were 199,943 homes for sale across Canada at the end of August, 1.4 per cent more than a year ago and the most for any August since 2019. A flat number, and a misleading one. Ontario’s inventory is down 3.9 per cent from last August and British Columbia’s is down 5.2 per cent — the sixth consecutive year-over-year decline in both — while Quebec’s is up 18.8 per cent, Manitoba’s 16.9 and Nova Scotia’s 13.6. Twelve months ago those signs were reversed. The levels are still worlds apart: Ontario has 46 per cent more homes for sale than in August 2019, and every province from Alberta east except Prince Edward Island has 15 to 57 per cent fewer. But for the first time since the correction began, the gap is closing from both ends.
Homes for sale by province, indexed to August 2019 — the thesis chart
Ontario 146 · BC 107 · Nova Scotia 85 · Quebec 77 · Alberta 69 · Saskatchewan 43
Every line starts at 100 in August 2019, the last normal summer. Ontario has 46% more homes for sale than it did then; Saskatchewan has fewer than half. Now look at Ontario's last two summers: the 2026 peak is lower than 2025's — the first lower high since the correction began.
The same series, year over year — the lines have crossed
Ontario −3.9% · BC −5.2% · Alberta +5.1% · Nova Scotia +13.6% · Manitoba +16.9% · Quebec +18.8%
Last August, Ontario and Alberta were adding listings at close to 20% a year while Quebec's and Manitoba's were shrinking. Twelve months later the order has flipped: supply is draining where there is too much of it and building where there is too little.
National homes for sale, one line per year
199,943 in August · +1.4% yr/yr · 6% below August 2019
The 2026 line sits almost exactly on top of 2025's. That flat national total is two opposite moves cancelling out — which is why the provincial charts above matter more than this one.
Why Ontario's inventory is falling: sellers stepped back
Ontario new listings −8.1% yr/yr in August · below 2025 in every month of 2026
This is not a demand story — Ontario sales fell 6% in August too. Fewer homes are arriving than are selling or coming off the market. A supply-led tightening puts a floor under prices; it is not a recovery.
Toronto, the clearest case
24,482 for sale, −11.3% · new listings −14.1% · sales −2.1%
Green bars are months with more homes for sale than a year earlier, red bars fewer. Seven straight red months, and the seasonally adjusted sales-to-new-listings ratio has climbed from 35.0% to 40.7% in a year. Still a buyer's market — just a tighter one than buyers had last fall.
Market balance
Buyer's market or seller's market? All 92 boards
CREA treats a seasonally adjusted sales-to-new-listings ratio between 45 and 65 per cent as balanced. Run that test on every board in the package and the country sorts into 35 buyer’s markets, 35 balanced and 22 seller’s. Thirty of the 35 buyer’s markets are in Ontario — Toronto, York Region, Mississauga, Durham, London, Barrie, Windsor-Essex, Kingston and most of cottage country — joined by Greater Vancouver, the Fraser Valley and three small boards elsewhere. The seller’s markets are the mirror image: Regina, Saskatoon, Lethbridge, Medicine Hat, Fredericton, Cape Breton, Thunder Bay. A year ago there were 27 of them. The big provinces tell the same story — every one moved toward the middle:
| Sales-to-new-listings, SA | Aug 2025 | Aug 2026 | Reading |
|---|---|---|---|
| Ontario | 40.3% | 42.0% | Buyer's market, slightly tighter |
| British Columbia | 42.7% | 45.3% | Buyer's → balanced, by a hair |
| Alberta | 62.3% | 58.4% | Balanced, looser |
| Quebec | 66.5% | 55.7% | Seller's → balanced |
| Canada | 50.3% | 49.1% | Balanced, unchanged in substance |
Quebec is the largest single move in the package: from a seller’s market to the middle of the balanced range in twelve months, on new listings up 12.7 per cent and sales down 7.3.
Sales-to-new-listings ratio in six cities, seasonally adjusted
Toronto 35.0 → 40.7 · Fraser Valley 32.4 → 40.1 · Winnipeg 71.9 → 63.6 · Halifax 69.4 → 63.6
CREA's balanced band is 45 to 65%. A year ago these six cities were spread across 40 points; today it is 24. The loosest markets have tightened, the tightest have loosened, and Winnipeg and Halifax have both slipped out of seller's territory.
Months of inventory by province, seasonally adjusted
BC 6.6 · Quebec 5.4 · Ontario 4.6 · Alberta 3.5
Quebec's line crossed above Ontario's in May and has kept climbing — 5.4 months against 4.2 a year ago. Ontario peaked at 5.5 in February and has eased since. Alberta is still the tightest big province, but it has added half a month of supply in a year.
All 105 markets, ranked by change in homes for sale
63 of 105 markets have more listings than a year ago · Oakville-Milton −20.5% · Toronto −11.3% · Quebec +18.8%
Skip the small boards at either end and read the large ones: the steepest inventory declines are in the Golden Horseshoe — the same boards with the weakest prices. Only 17 of Ontario's 44 boards are down, but they are the big ones; London, Ottawa and most of cottage country are still building.
Unit statistics
Property types: the averages hide the mix
CREA’s unit statistics break 75 boards out by property type — median and average price, sales and days on market for detached, semi-detached, townhouse and apartment. (Toronto and Calgary are not in this dataset; the TRREB report covers the GTA by home type.) Single months are noisy for thin segments, so the comparisons below average June through August against the same three months of 2025.
Greater Vancouver median price by property type
Detached $1,700,000 · townhouse $935,000 · apartment $645,000
Averaged over the summer, medians are down 4% for detached homes, 7% for townhouses and 6% for apartments from a year ago — and all three sit 12 to 14% below their spring 2022 highs. The correction is broad, not a condo story.
Edmonton: one city, two markets
Detached $514,700 · townhouse $292,000 · apartment $190,000
Detached medians set a record this summer while apartments still trade about 21% below their 2007 peak. “Edmonton is up” is true for a house and has not been true for a condo in nineteen years.
The other number worth carrying into a listing appointment is time. Median days on market were longer than a year ago in 21 of the 28 largest boards in the dataset — Edmonton 29 days against 25, Greater Vancouver 29 against 26, Hamilton-Burlington 32 against 27, Waterloo Region 26 against 20 — including markets where prices are still rising. Homes are taking longer to sell almost everywhere; what differs is whether the price holds while they wait.
In the field
What to tell clients this week
Three conversations the data supports. None of them is a forecast — each is what the August numbers say, and nothing past them.
Selling in Ontario or the Lower Mainland
Your competition is thinning — Toronto has 11% fewer homes for sale than last August — but buyers have not come back: sales are down too. Tighter supply defends your price; it does not raise it. Price to the last 60 days of sold comparables, not to the spring.
Buying in Ontario or the Lower Mainland
It is still a buyer's market on CREA's own bands in 30 of Ontario's 44 boards, and in Greater Vancouver and the Fraser Valley. But selection peaked in 2025. The leverage is real today, and the inventory trend says it is slowly shrinking.
Buying or selling on the Prairies, in Quebec or in Atlantic Canada
Still tight by any historical measure — Saskatchewan has 43% of the listings it had in 2019 — but no longer tightening. Expect more choice and longer days on market rather than lower prices: averages are still rising in Alberta (+3.8%), Quebec (+3.6%) and Saskatchewan (+2.6%).
The honest risk to all three: rates. The Bank of Canada’s overnight rate is 2.25 per cent and the posted five-year is 6.09, and CREA’s own economist noted on Tuesday that markets have priced in a hike. Falling inventory with falling sales is a truce, not a turn in demand — a rate move in either direction ends it.
Method
Method & sources
All figures are from the Canadian Real Estate Association’s August 2026 data package (aggregate and unit statistics), loaded into the Homies Stats feed on September 18, 2026. Levels and year-over-year changes are actual (not seasonally adjusted) residential figures, the same basis as CREA’s board tables; market-balance readings use CREA’s seasonally adjusted sales-to-new-listings ratio and months of inventory, with boards classified on the ratio rounded to one decimal against the 45–65 per cent band. Ottawa sits exactly on the line at 45.0 and is counted as balanced. “Canada” is the sum of the provinces and territories. Inventory is indexed to August 2019 so that both ends of the comparison are the same month. Property-type comparisons average three months of medians; the “28 largest boards” are those with at least 250 sales in August in the unit statistics, which exclude Toronto and Calgary. Year-over-year comparisons use figures as first reported. Charts are live embeds of the Homies Stats explorer , so they will move on when CREA’s September package arrives in mid-October; the captions describe August. Mortgage and policy rates are Bank of Canada data via the same feed.
Planning and legal notice
Data sourced from CREA aggregate and unit statistics and visualized by Homies Stats. This independent visualization tool is not affiliated with or endorsed by CREA. MLS® and the associated logos are trademarks of the Canadian Real Estate Association. Data is provided for information, not as investment advice.