Two Canadas, in charts you can touch.
CREA's August numbers came out this morning. Here they are as an interactive report — eleven live charts, every one zoomable and sourced — plus the prompt that rebuilds it for any province or board in the country.
Live data
The August release loaded into the Homies Stats feed the day it dropped — 104 markets, back to 1980 for the national series.
Eleven charts
Provinces on one index, year overlays, sales against rates, and every market ranked. Nothing is a screenshot.
Yours
The prompt rebuilds this for Canada, any province, or any of 100+ boards — with an optional lead funnel and Instagram assets.
Prompt library
Make your own version of this report
Every chart on this page is a live view of the same feed any Homie can read. Copy the prompt, paste it into Homies (or any AI with web access), and answer four questions — your market, your audience, whether to gate the full report behind a lead-capture form, and whether you want an Instagram carousel or story. It writes a report like this one for Canada, your province, or your board, with these same interactive charts pointed at your market and this month’s real numbers. New to the idea? Start with the guide to AI market reports for realtors — what they are, the free Canadian real estate stats underneath, and how they compare with market report software.
- 1
Copy the prompt
Hit copy below — it's complete, nothing to fill in first.
- 2
Paste it into Homies
Or any AI with web access. It asks four questions, then waits for you.
- 3
Answer four questions
Market, audience, gated or open, and whether you want Instagram assets. Silence takes the defaults.
- 4
Review, then publish
It writes the report with these same live charts and stops for your approval before anything is sent or posted.
August 2026
Flat on the surface, split underneath
Canadian home sales slipped 0.7 per cent from July on a seasonally adjusted basis and came in 6.9 per cent below August 2025— 37,504 transactions, the fourth consecutive month of what CREA calls “largely unchanged” activity. The national average price was $668,219, up 0.6 per cent year over year and still 19 per cent below the February 2022 peak. New listings rebounded 3.3 per cent as sellers got an early start on the fall market, which nudged the sales-to-new-listings ratio down to 49.1 per cent. Four months of inventory, four months of flat prices, four months of flat sales: the national picture is a market holding its breath while, per CREA’s senior economist, fixed rates have already risen on bond yields and a variable-rate hike is “priced in by markets.”
Home sales
37,504
−6.9% yr/yr (actual) · −0.7% m/m (SA)
Average price
$668,219
+0.6% yr/yr · 19% below the Feb 2022 peak
New listings
74,028
+3.3% m/m (SA) — sellers came back late in the month
Sales-to-new-listings
49.1%
seasonally adjusted · long-term average 54.7%
Months of inventory
4.8
unchanged for four months · long-term average 5.0
MLS® HPI (composite)
−3.0% yr/yr
flat month over month · benchmark $657,400
None of that is the story. The story is that “Canada” has stopped being a useful unit for talking about house prices — and the first two charts show why.
Prices since the peak
Two Canadas
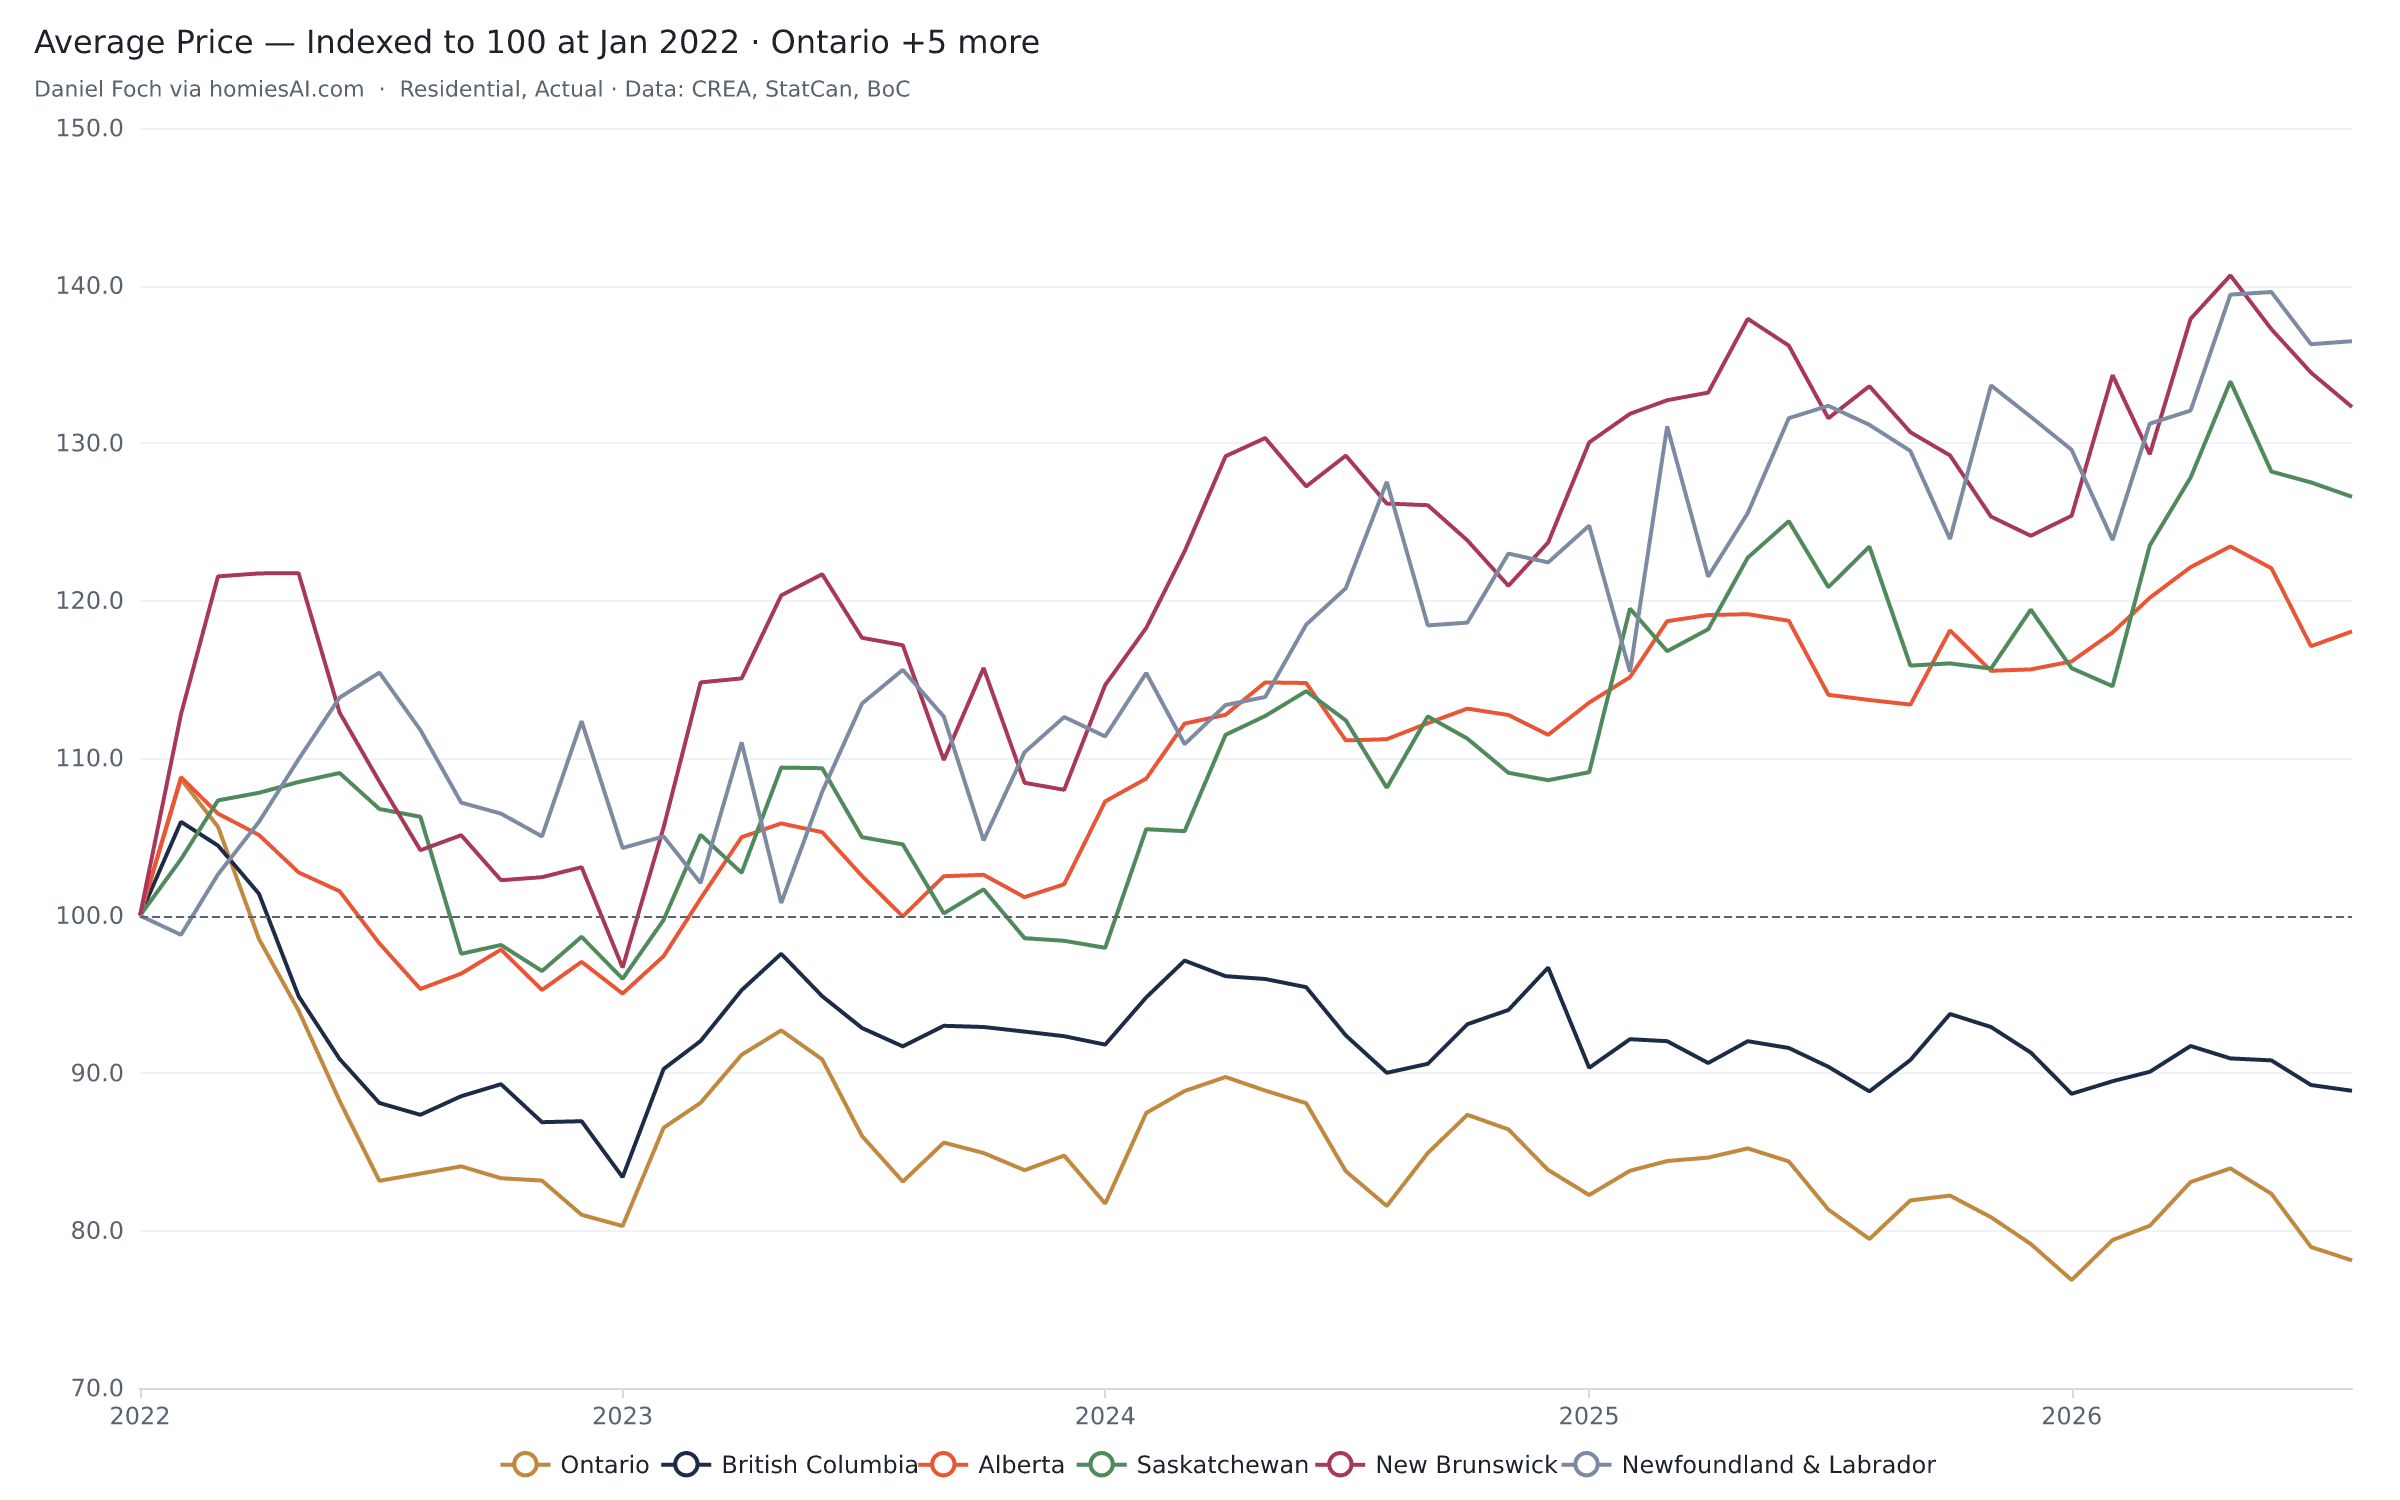
Index every province’s average price to 100 in January 2022 and the country splits cleanly in two. Ontario is at 78 — still 22 per cent below where it started — and British Columbia at 89. Everyone else is above 100: Alberta 118, Manitoba 118, Nova Scotia 120, Saskatchewan 127, New Brunswick 132, Newfoundland 137. The national average sits at 88 only because Ontario is so large. Drag the brush under either chart to zoom into any window.
Provinces, indexed to January 2022 — the thesis chart
Ontario 78 · BC 89 · Alberta 118 · Saskatchewan 127 · New Brunswick 132 · Newfoundland 137
Same country, same rates, opposite decades. Every line starts at 100 in January 2022; where it sits now is the whole post-peak story in one number.
The big cities on the same scale
Toronto 80 · Vancouver 95 · Ottawa 101 · Halifax 107 · Winnipeg 114 · Edmonton 121 · Calgary 124
Toronto is the outlier, not the market. Calgary and Edmonton have gained a fifth since the peak while Toronto gave back a fifth.
Demand
Sales are stuck, and the rate tailwind is turning
The year-overlay view puts each year’s sales on the same January-to-December axis. 2026’s spring never got going — the lowest spring peak of the five years — and since May the line has gone sideways rather than following the usual summer decline. That is what “largely unchanged for a fourth consecutive month” looks like. The third chart is the one to watch into the fall: sales plotted against the five-year mortgage rate with the rate axis inverted, so cheaper money plots upward. Sales chased the rate line up in 2020 and down in 2022; if a hike is really priced in, the red line turns down first.
National sales, one line per year
August 37,504 — below every August since 2019
Trace the blue 2026 line: the spring peak was the lowest of the five years, and the curve has flattened since May instead of the usual summer step-down.
Sales and new listings on one chart
Sales −7% yr/yr · listings −3% yr/yr · ratio 49.1% (SA)
When the red line rebounds while the black one doesn't, the ratio eases — that's August. Balanced, but the gap is opening in buyers' favour.
Sales against the 5-year mortgage rate, inverted
Posted 5-year 6.09% · overnight 2.25%
The rate line is upside down, so up means cheaper money. Sales followed it up in 2020 and down in 2022 — and CREA's own warning this month is that the next move is a hike.
Thirty years of seasonality, one heatmap
Rows are months, columns are years, colour is sales volume
Spring is always the peak. 2021 burned orange for a full year; 2026's spring is the coolest of the last five. Hover any cell for the number.
Supply
Sellers came back late — and there is still not much for sale
August’s 3.3 per cent rebound in new listings reversed three straight monthly declines, and CREA says it was “most apparent towards the end of the month” — a late Labour Day pulling the fall market forward. Even so, total supply is just under 200,000 homes, in line with the seasonal norm and only 1.4 per cent above a year ago. At 4.8 months of inventory the country is balanced by CREA’s own bands (seller’s market below 3.6, buyer’s above 6.4), and has been for four months.
New listings, one line per year
74,028 in August · +3.3% m/m (SA) after three straight declines
Late Labour Day, early fall market: sellers who sat out the summer listed in the last two weeks of August. Watch whether September's line stays above 2025's.
Months of inventory since 2005
4.8 months, unchanged for four months · seller's <3.6 · buyer's >6.4
Just under 200,000 homes for sale — normal for the season. We're a full point looser than 2021 and nowhere near 2008.
Prices
A flat national line hides two opposite trends
The MLS® Home Price Index was unchanged from July and down 3.0 per cent from a year ago — the smallest annual decline since October 2025, with the gap narrowing every month since January. The average price, which is mix-sensitive, is faintly positive year over year. Break either measure out by province and the flatness disappears: Alberta is up 3.8 per cent, Ontario down 1.7. The leaderboard ranks every market in CREA’s release by price change; the full set of 104 markets fills in when the complete August data package lands later this week.
Average price, year-over-year, by province
Canada +0.7% · Alberta +3.8% · BC 0.0% · Ontario −1.7%
The national line is flat because Ontario's decline and the Prairies' gains cancel out. Nobody lives in the average.
Every market in the release, ranked by price change
Yukon +8.4% · Saint John +7.3% · Thunder Bay +5.2% · Calgary +5.0%
The top of the board is small and far from Toronto. Scroll it: the bottom is Southern Ontario, in order.
The national average price against its peak
$668,219 · peak $825,768 in February 2022 · −19.1%
Flat for four months, which CREA calls the longest stretch of price stability since 2024. The chart shows why that is a floor and not a recovery.
Method
Method & sources
Headline figures are from the Canadian Real Estate Association’s August 2026 statistics release (September 15, 2026). CREA’s month-over-month changes are seasonally adjusted; the charts and the feed are actual (not seasonally adjusted) residential figures — the same basis as CREA’s own table of select boards — which is why the feed’s sales-to-new-listings ratio (50.7%) differs slightly from the seasonally adjusted headline (49.1%). Charts are live embeds of the Homies Stats explorer . The August month is loaded from the press release as a preliminary update for the national series, provinces, and the 18 boards CREA reports; the remaining boards, and active listings, update when the full data package is published. Year-over-year comparisons in the charts use figures as first reported; CREA’s headline compares against revised prior-year values. Mortgage and policy rates are Bank of Canada data via the same feed.
Planning and legal notice
Data sourced from CREA aggregate statistics and visualized by Homies Stats. This independent visualization tool is not affiliated with or endorsed by CREA. MLS® and the associated logos are trademarks of the Canadian Real Estate Association. Data is provided for information, not as investment advice.