Canada’s population revision.
Statistics Canada revised away most of Canada’s reported population decline. Housing demand still slowed—and rental relief can coexist with a future supply problem.
+301,008 revised
The April 1 estimate changed; these are not new arrivals.
0.5% growth
The annual slowdown survives the statistical correction.
Housing, by segment
Rents, households and future supply in 12 charts.
SVG + 2400px PNG + CSV · no sign-in
Chapter 01 / Housing research
Canada’s population revision changes the housing story—not the housing market overnight
Statistics Canada revised its April 1, 2026 population estimate upward by 301,008 people. That correction overturns the earlier picture of three consecutive quarterly declines, but it does not represent 301,008 new arrivals or a sudden increase in Canadian housing demand. These were residents whom the updated statistical system estimates were already here. The revised data show a country growing much more slowly, with fewer non-permanent residents, while rental conditions ease and the construction pipeline faces pressure. The housing conclusion is therefore more useful than either a boom or crash headline: Canada’s demand slowdown is real, but the preliminary population numbers overstated it. [1][2][3]
For renters, the decisive question is whether suitable homes are becoming easier to find at an affordable monthly payment. For condominium owners and developers, it is whether current competition is accompanied by a shrinking future supply pipeline. For freehold buyers, household incomes, financing costs and neighbourhood inventory still matter more than a revision published on one Wednesday. This report separates the measurement correction from actual demographic change, then connects each to the housing evidence available on September 30, 2026. It offers a framework for interpreting the market, not a house-price forecast.
Chapter 02 / Housing research
The 301,008 correction compares two estimates of the same day
In June, Statistics Canada estimated Canada’s April 1 population at 41,417,056. The September vintage puts that same date at 41,718,064. Subtracting those two estimates produces the 301,008 revision, equivalent to roughly 0.73% of the earlier estimate. Subtracting different publication vintages is appropriate for measuring a revision; it is inappropriate for measuring how many people arrived between publications. Actual growth requires comparing dates within one consistent vintage. [2][3]
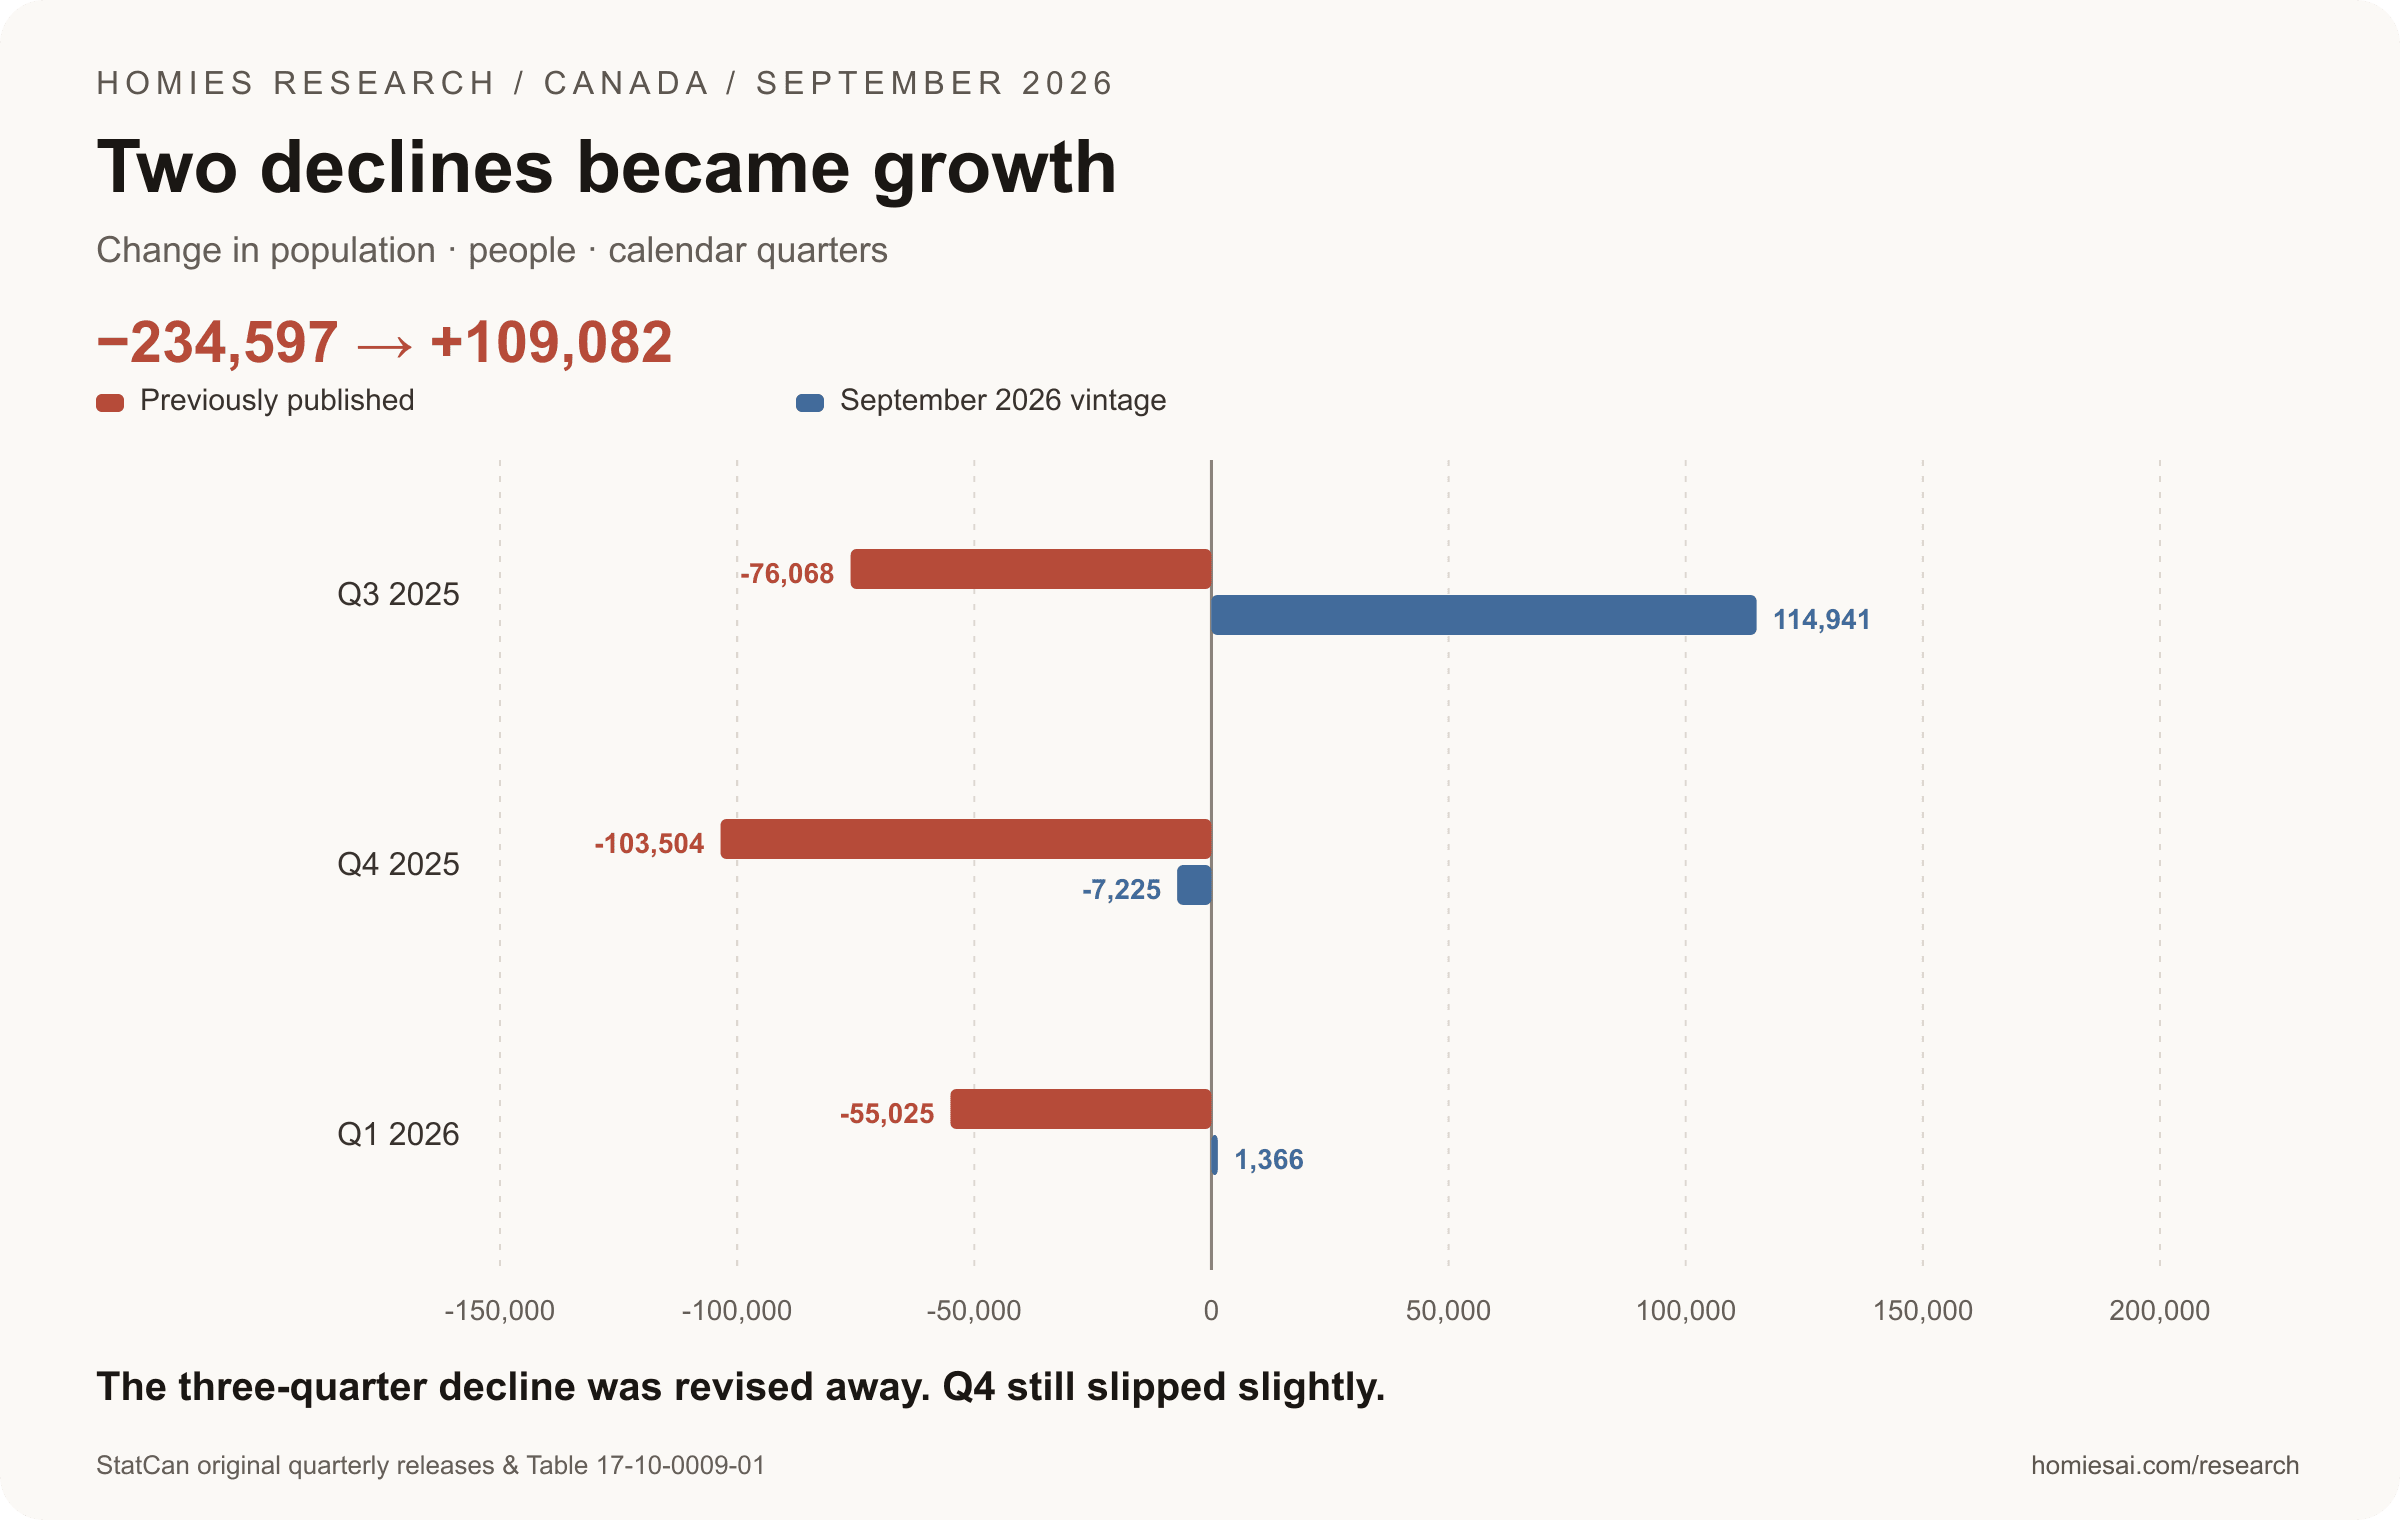
That distinction changes the recent timeline. The originally reported changes were −76,068 in the third quarter of 2025, −103,504 in the fourth quarter and −55,025 in the first quarter of 2026. Using the latest stocks, those quarters become +114,941, −7,225 and +1,366 respectively. Canada still registered a small fourth-quarter decline. Across the formerly declining three-quarter period, however, population increased by 109,082. Calendar 2025 growth was 280,810. “Canada didn’t shrink” therefore needs a stated period, rather than becoming a claim that every quarter expanded. [2][3][4][5]
The revision also varies by date: the July 2025 estimate moved down by 42,671 relative to the stock implied in the original December release. The chart’s two lines are different statistical vintages, not two competing realities. That is why a careful housing analysis should update its entire baseline instead of simply adding 301,008 to every historical observation. [2][4]
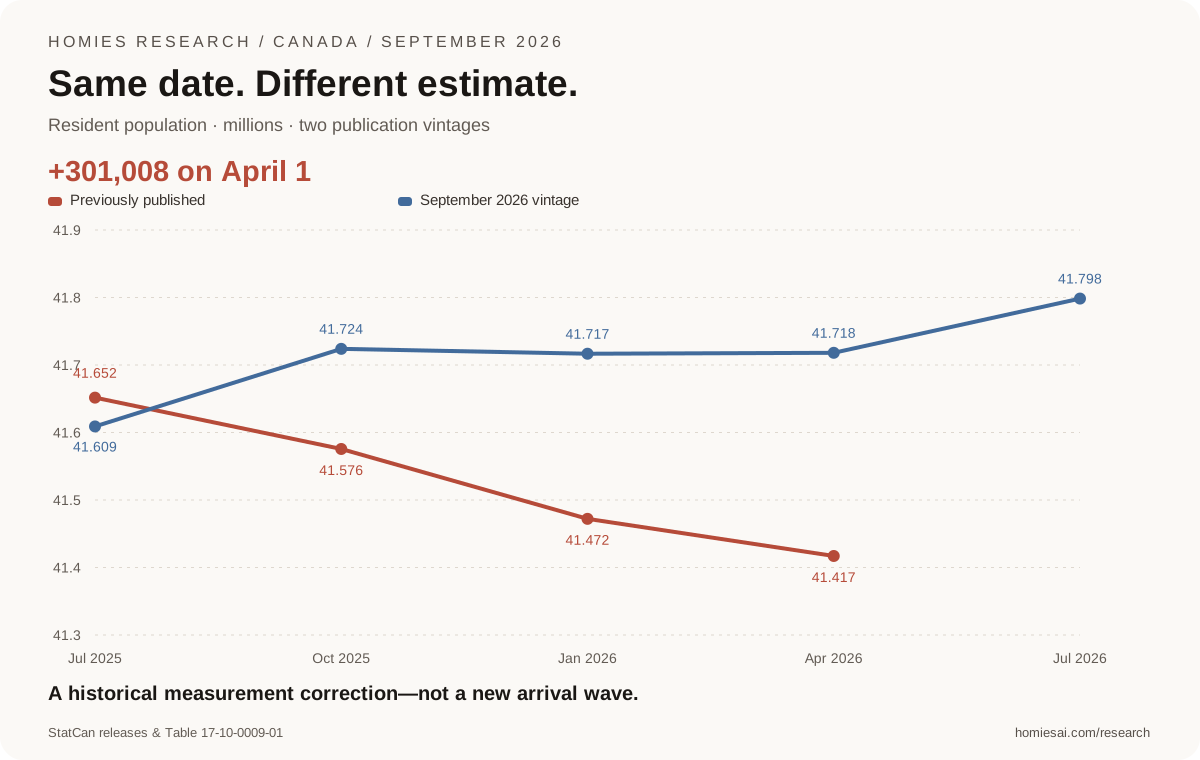
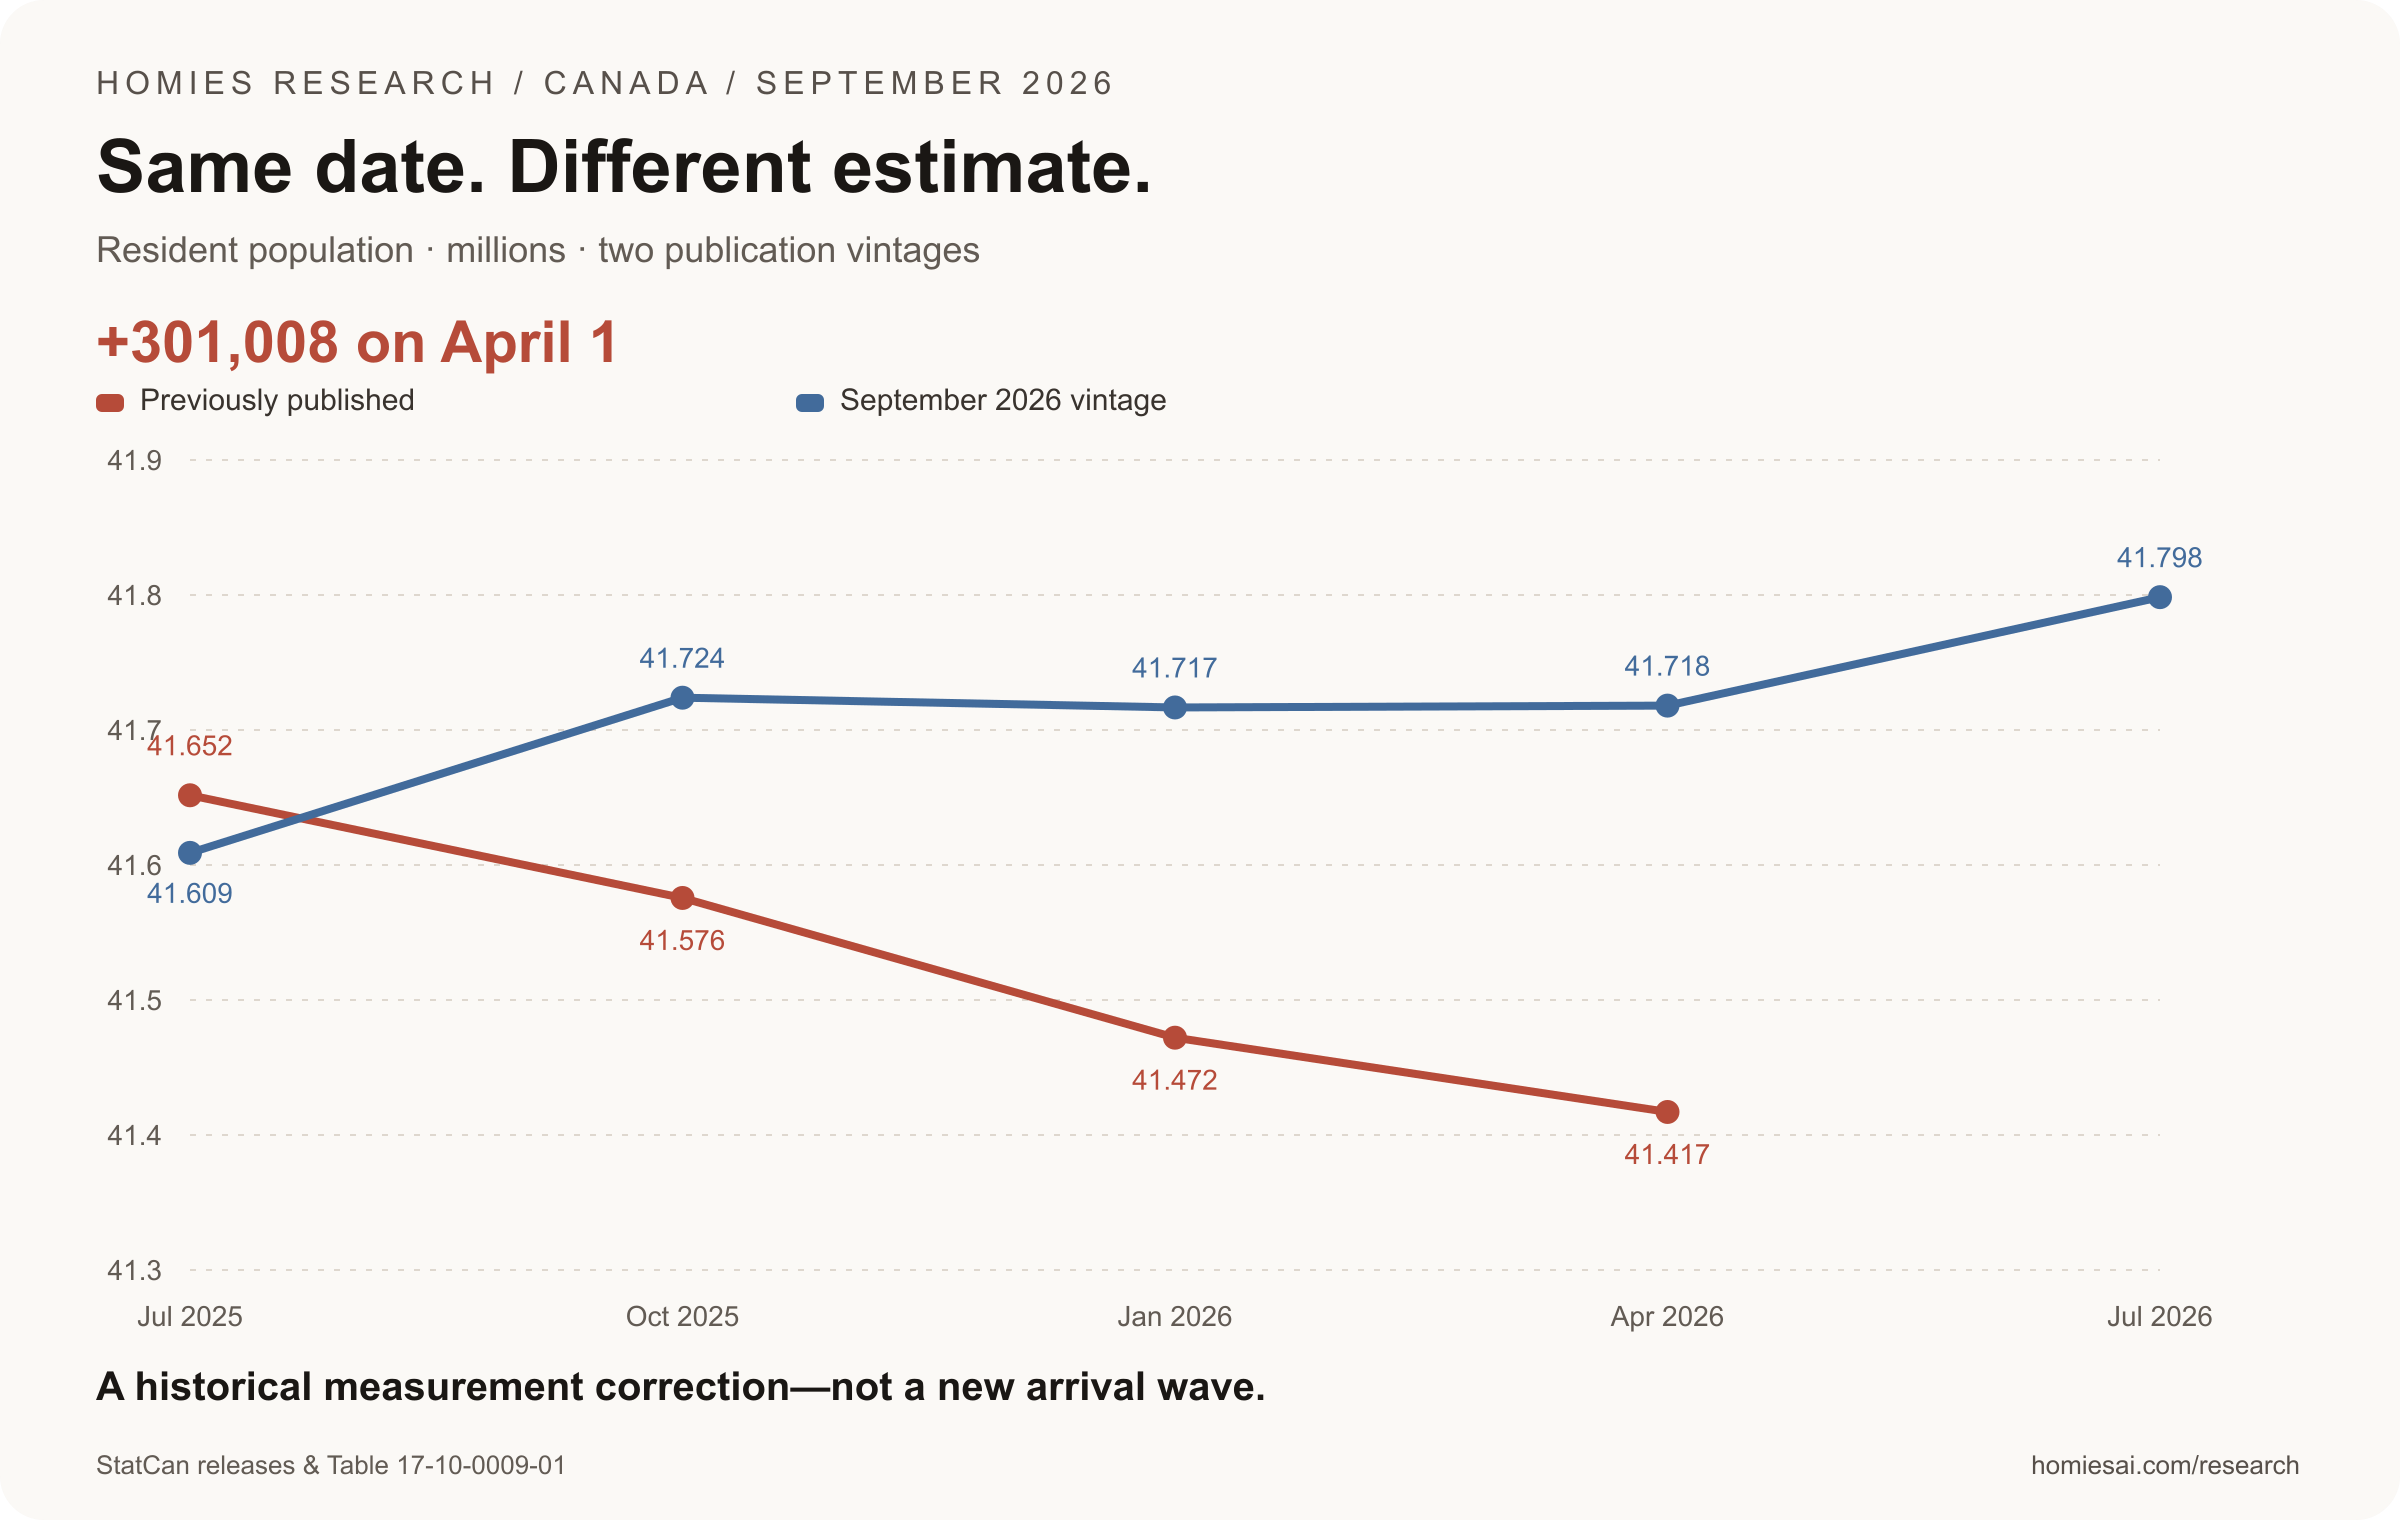
Vertical scale starts above zero to show the revision. July 2025 itself was revised down 42,671. Old series ends April 2026.
Source: StatCan releases & Table 17-10-0009-01. Research cutoff: September 30, 2026.
View exact values and units
| Period / group | Previously published (million) | September 2026 vintage (million) |
|---|---|---|
| Jul 2025 | 41.651653 | 41.608982 |
| Oct 2025 | 41.575585 | 41.723923 |
| Jan 2026 | 41.472081 | 41.716698 |
| Apr 2026 | 41.417056 | 41.718064 |
| Jul 2026 | Not published | 41.798407 |
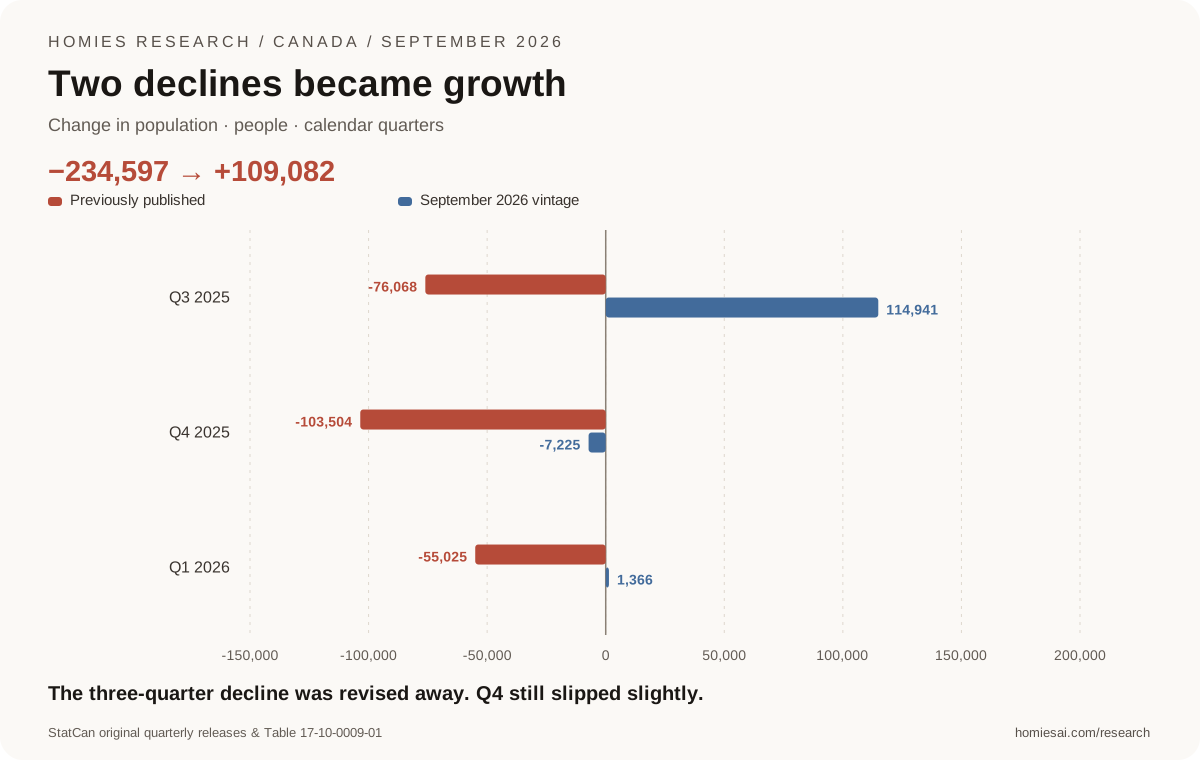
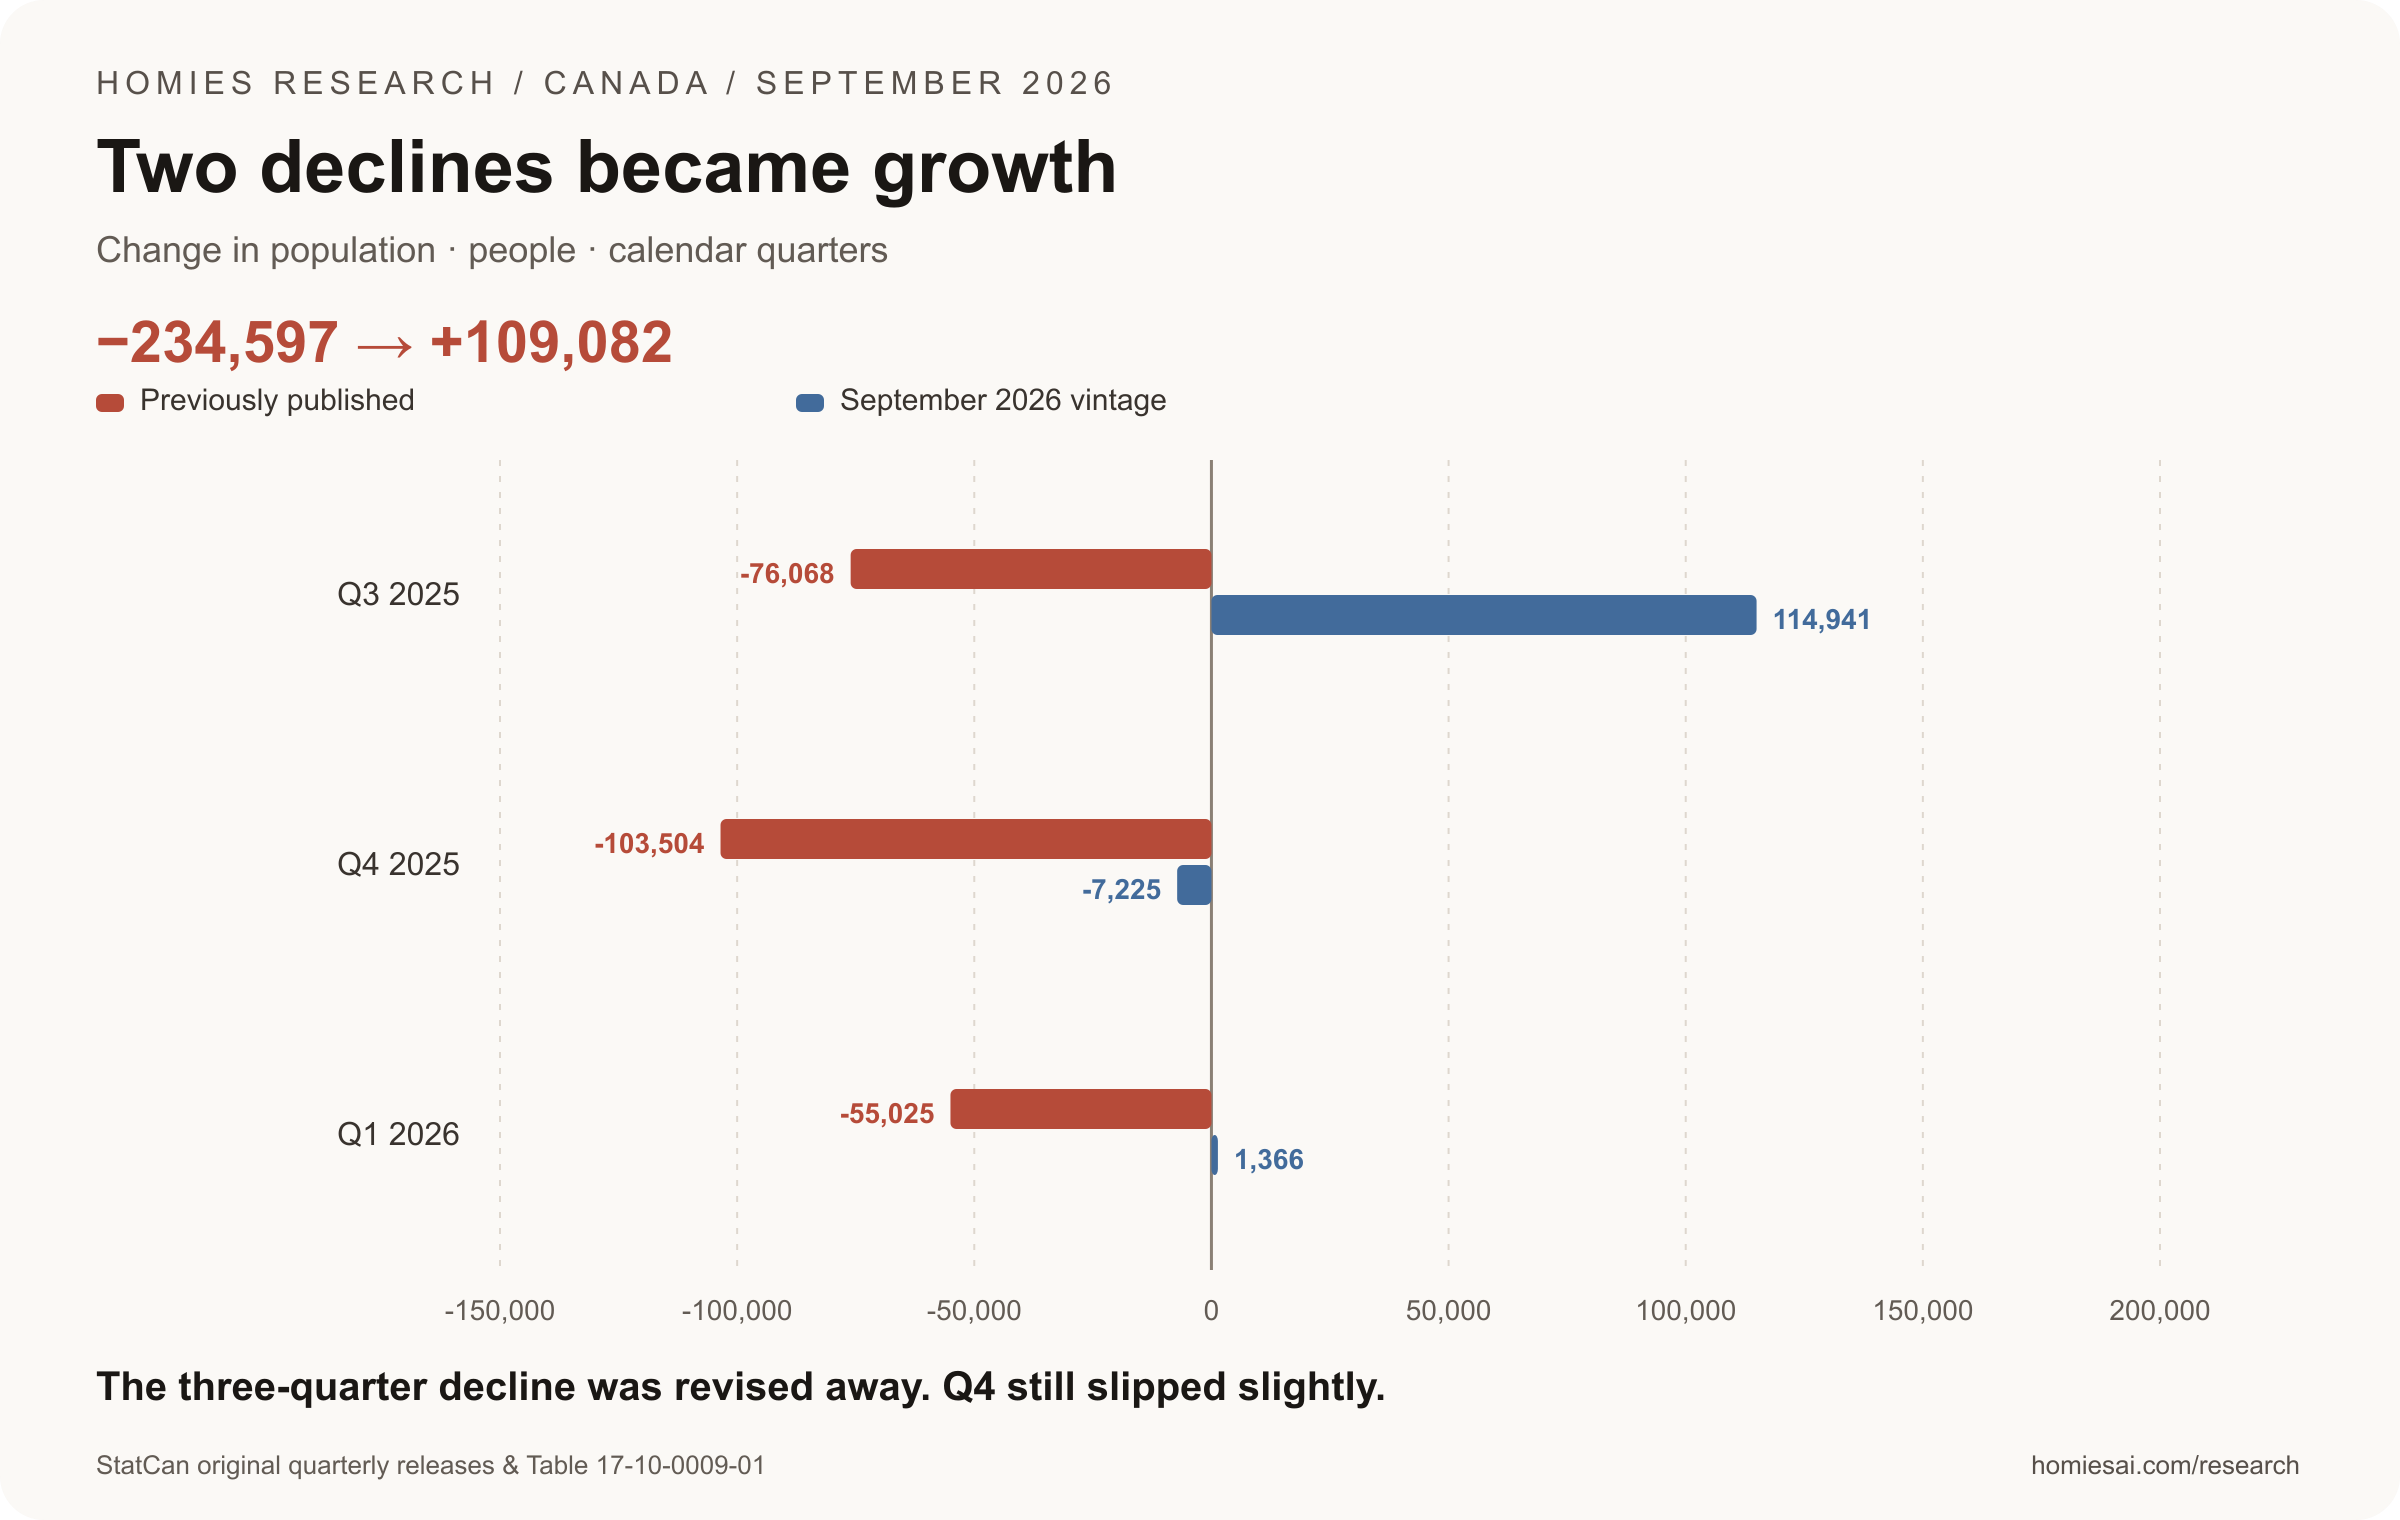
Old bars reproduce original releases; new bars use one consistent September vintage. Q2 2026 first print: +80,343.
Source: StatCan original quarterly releases & Table 17-10-0009-01. Research cutoff: September 30, 2026.
View exact values and units
| Period / group | Previously published (people) | September 2026 vintage (people) |
|---|---|---|
| Q3 2025 | -76,068 | 114,941 |
| Q4 2025 | -103,504 | -7,225 |
| Q1 2026 | -55,025 | 1,366 |
Chapter 03 / Housing research
Permit records can change before someone’s housing changes
The largest part of the April correction was in non-permanent residents, or NPRs. Their estimated stock rose from 2,558,562 in the June release to 2,798,649 in the revised table: a 240,087 difference, approximately 80% of the total population revision. That is a statistical category that includes temporary permit holders and other covered residents; it is not a synonym for undocumented people. [3][6]
September’s update used newer immigration records, improved estimates of extensions not yet recorded, and Canada Border Services Agency entry and exit information to adjust for permit holders leaving before expiry. The mechanisms work in different directions. The published evidence does not provide a numerical decomposition allowing us to assign all 301,008 people to one cause. [1]
Consider an illustrative renter whose permit expires while an extension application is being processed. Applicable maintained-status rules can permit that person to remain, and sometimes continue working, during processing. Their administrative record can catch up after their rent payment does. Statistics Canada’s technical guide explains how recorded in-Canada extensions can restore a resident through the intervening estimation gap. This is an explanation of the process, not a count of how many revised residents followed that exact path. [7][8]
The strongest criticism is about planning under uncertainty: rapidly changing administrative backlogs make preliminary estimates less dependable. The strongest counterpoint is transparency. The June release explicitly warned that its reported decline could become growth after revision. A large correction deserves scrutiny without being treated as evidence of manipulation. [3]
Chapter 04 / Housing research
Population growth still slowed from 2.8% to 0.5%
The latest July-to-July growth rate is 0.5%, down from 2.8% in 2023/24 and 1.1% in 2024/25. Between July 2025 and July 2026, the total population rose by 189,425, while the NPR stock fell by 154,614. Both statements can be true at once. A shrinking temporary-resident population does not require the whole country to shrink, because other demographic components and transitions also matter. [1][2][6]
The revised NPR stock peaked at 2,984,285 in October 2024 and stood at 2,779,774 in July 2026. The shape of the curve matters more for current demand momentum than the publication-day correction. Fewer additional residents means less incremental pressure than during the extraordinary growth surge, even when the existing population base is larger than previously estimated. [6]
Housing markets already absorb signals that a national population estimate captures imperfectly: applications for leases, school enrolment, showings, arrears, employment and local moves. Revising the resident count improves the explanation of those signals; it does not replace them. An investor who reads the revision as an immediate buying signal makes the same analytical mistake as one who read a preliminary decline as proof that demand had disappeared.
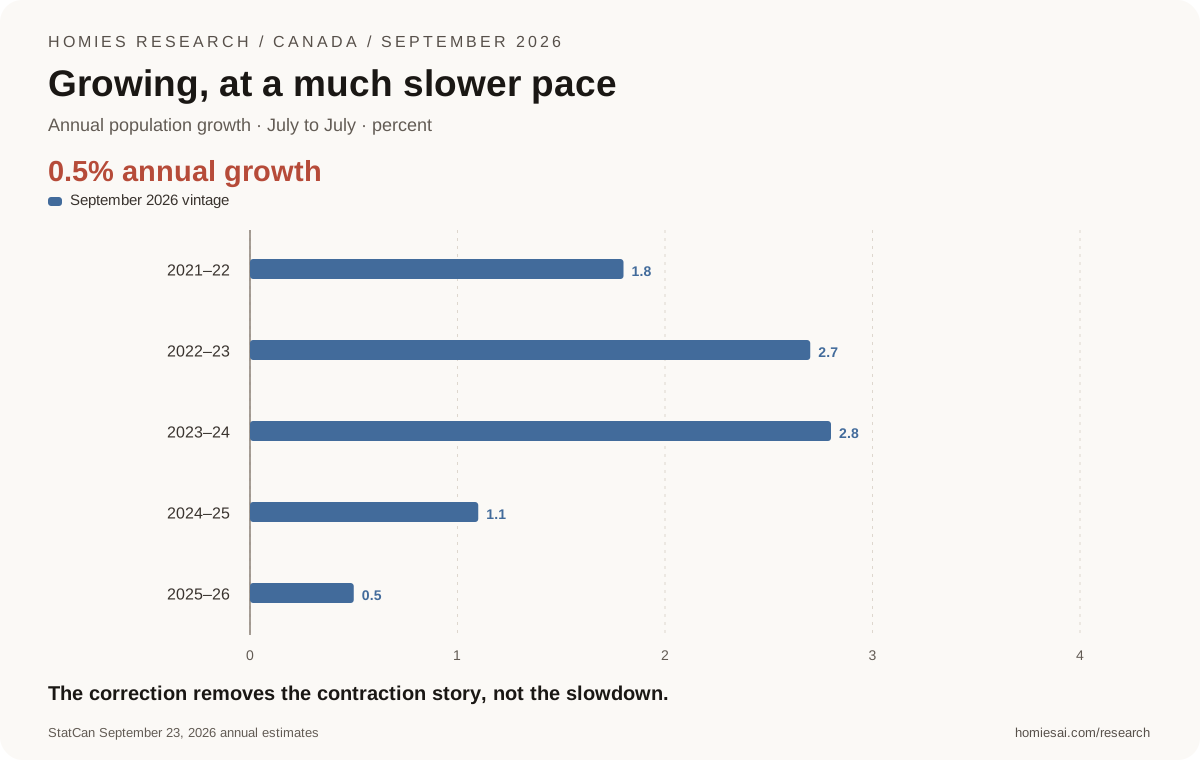
Published rates rounded to one decimal. 2025–26: +189,425 people; lowest percentage growth since 1915–16.
Source: StatCan September 23, 2026 annual estimates. Research cutoff: September 30, 2026.
View exact values and units
| Period / group | September 2026 vintage (%) |
|---|---|
| 2021–22 | 1.8 |
| 2022–23 | 2.7 |
| 2023–24 | 2.8 |
| 2024–25 | 1.1 |
| 2025–26 | 0.5 |
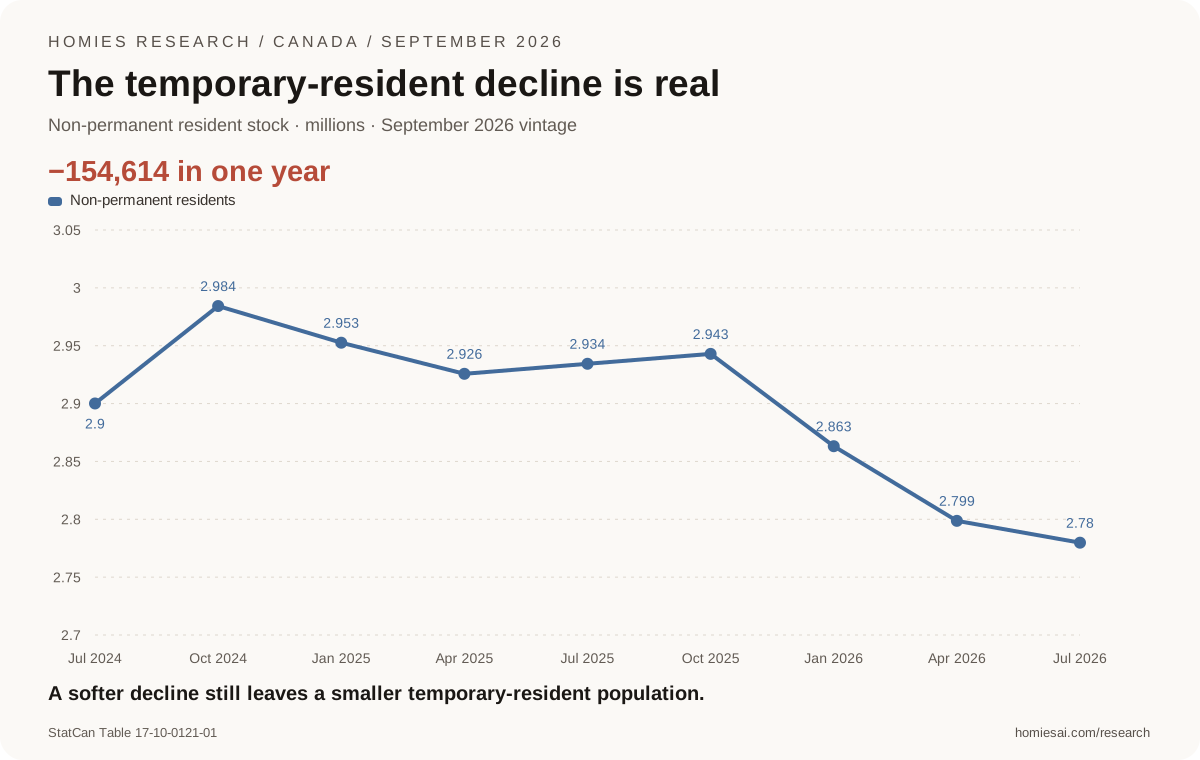
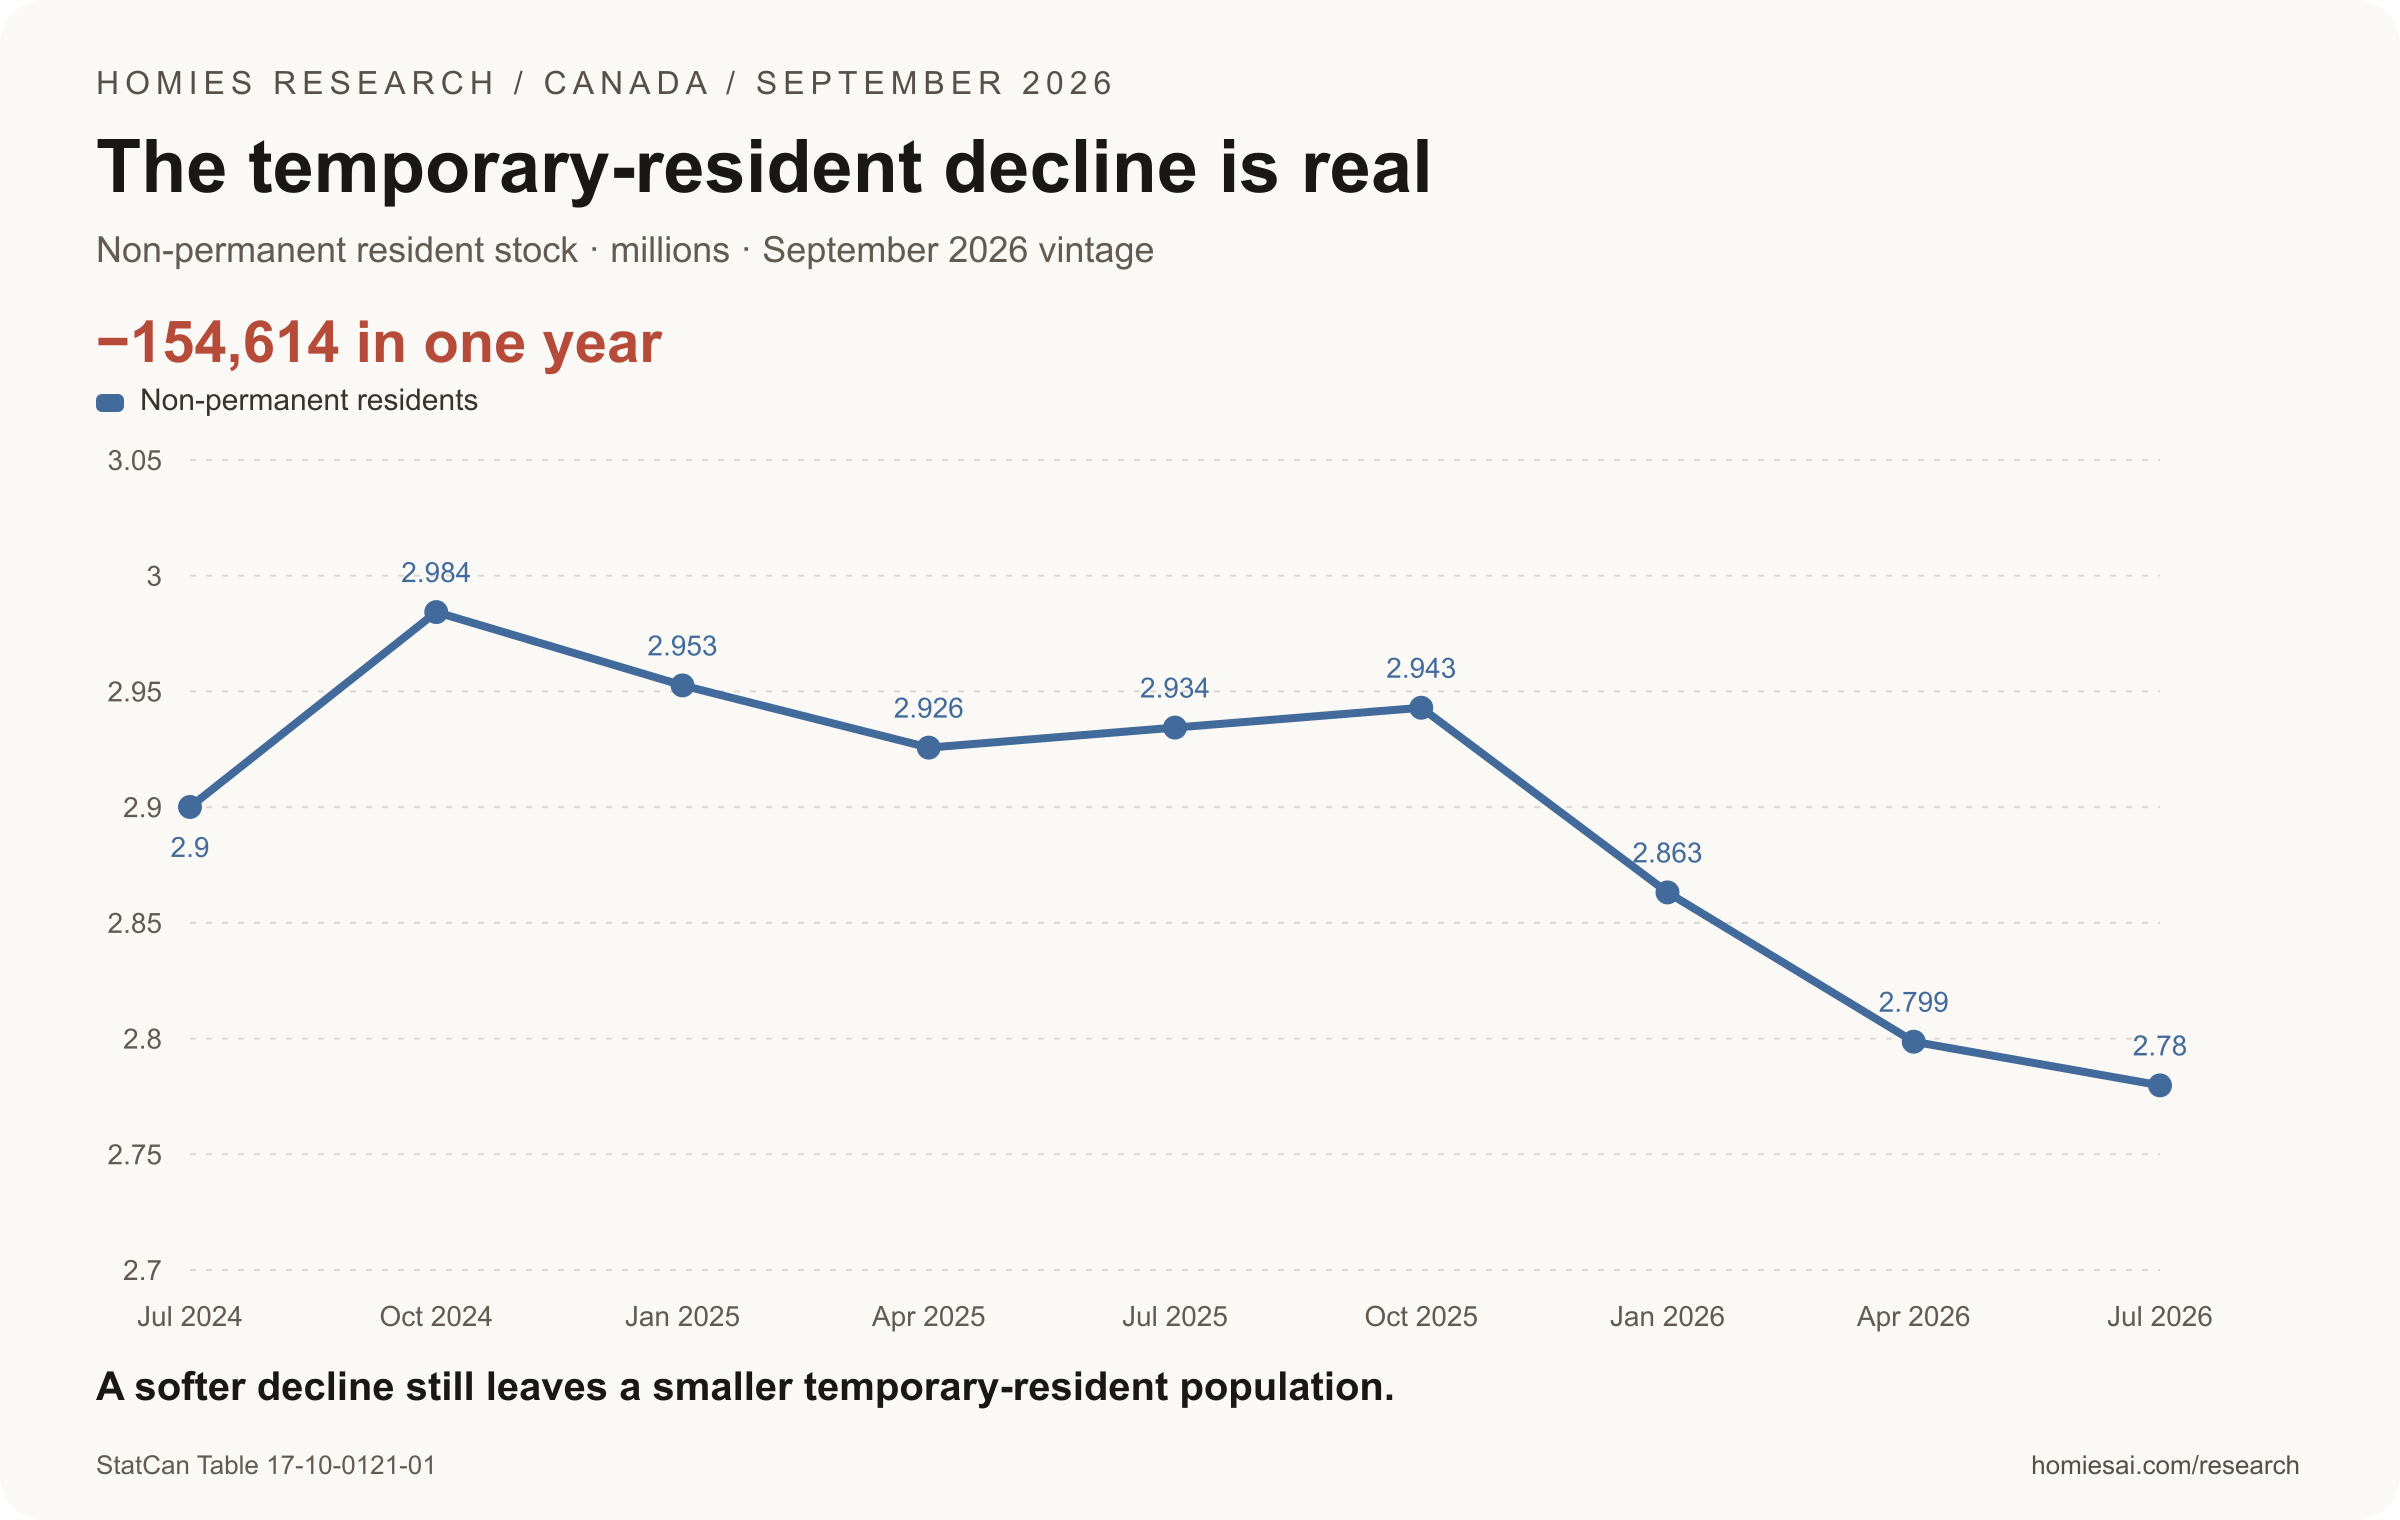
Stock changes include arrivals, departures, status transitions and demographic adjustments. They are not departure counts.
Source: StatCan Table 17-10-0121-01. Research cutoff: September 30, 2026.
View exact values and units
| Period / group | Non-permanent residents (million) |
|---|---|
| Jul 2024 | 2.900083 |
| Oct 2024 | 2.984285 |
| Jan 2025 | 2.952596 |
| Apr 2025 | 2.925722 |
| Jul 2025 | 2.934388 |
| Oct 2025 | 2.942949 |
| Jan 2026 | 2.863151 |
| Apr 2026 | 2.798649 |
| Jul 2026 | 2.779774 |
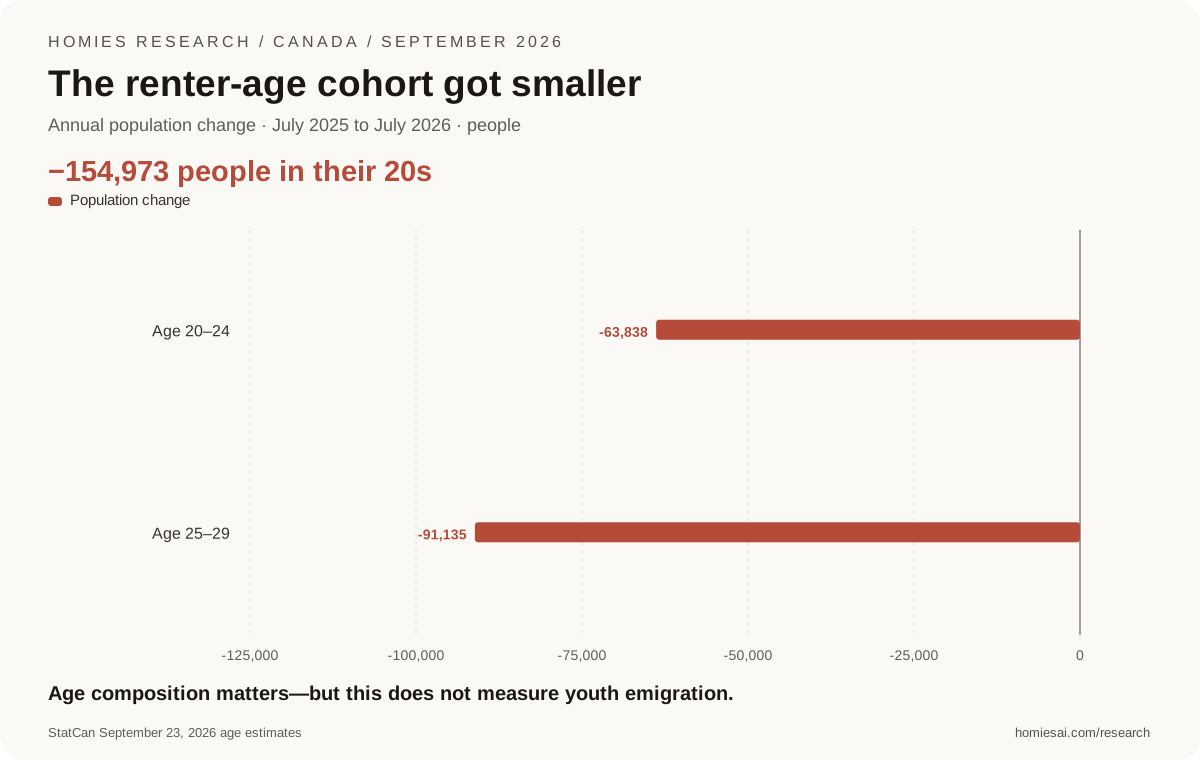
Changes reflect aging into/out of cohorts, deaths and migration. A declining age group does not prove a brain drain.
Source: StatCan September 23, 2026 age estimates. Research cutoff: September 30, 2026.
View exact values and units
| Period / group | Population change (people) |
|---|---|
| Age 20–24 | -63,838 |
| Age 25–29 | -91,135 |
Chapter 05 / Housing research
Rental conditions eased, but affordable vacancies remain scarce
The newer rental evidence supports a slowdown. Statistics Canada’s experimental second-quarter 2026 survey put the average asking rent for a two-bedroom apartment across census metropolitan areas at $2,130, down 3.6% from a year earlier. These are listing-based estimates, subject to revision and not adjusted to hold unit quality constant. They describe available listings rather than the rent every tenant pays. [9]
CMHC’s October 2025 survey provides a separate view: national purpose-built apartment vacancy rose from 2.2% to 3.1%. Vacancy was 1.4% in the lowest rent quartile and 5.3% in the highest. Average same-sample two-bedroom rents still increased 5.1%. Those measures cover a different period and sample from Statistics Canada’s asking-rent survey, so they should not be joined into one continuous series. [10]
There is no contradiction in falling new-lease asking rents and rising average rents paid. Existing tenants can still experience increases while new tenants encounter more competition among landlords. A building can offer a concession to fill an expensive unit without making the cheapest unit affordable to a lower-income household. The important housing question is therefore where the vacancies are, not just how many exist.
Compare asking and paid rent as two different samples, not as guaranteed savings on the same apartment. In Toronto the Q2 2026 chart shows $2,650 asking versus $2,160 paid; in Vancouver, $3,030 versus $2,470. Moving can still mean a substantial payment increase even when asking rents have softened. Rental relief and affordability stress can coexist. [19]
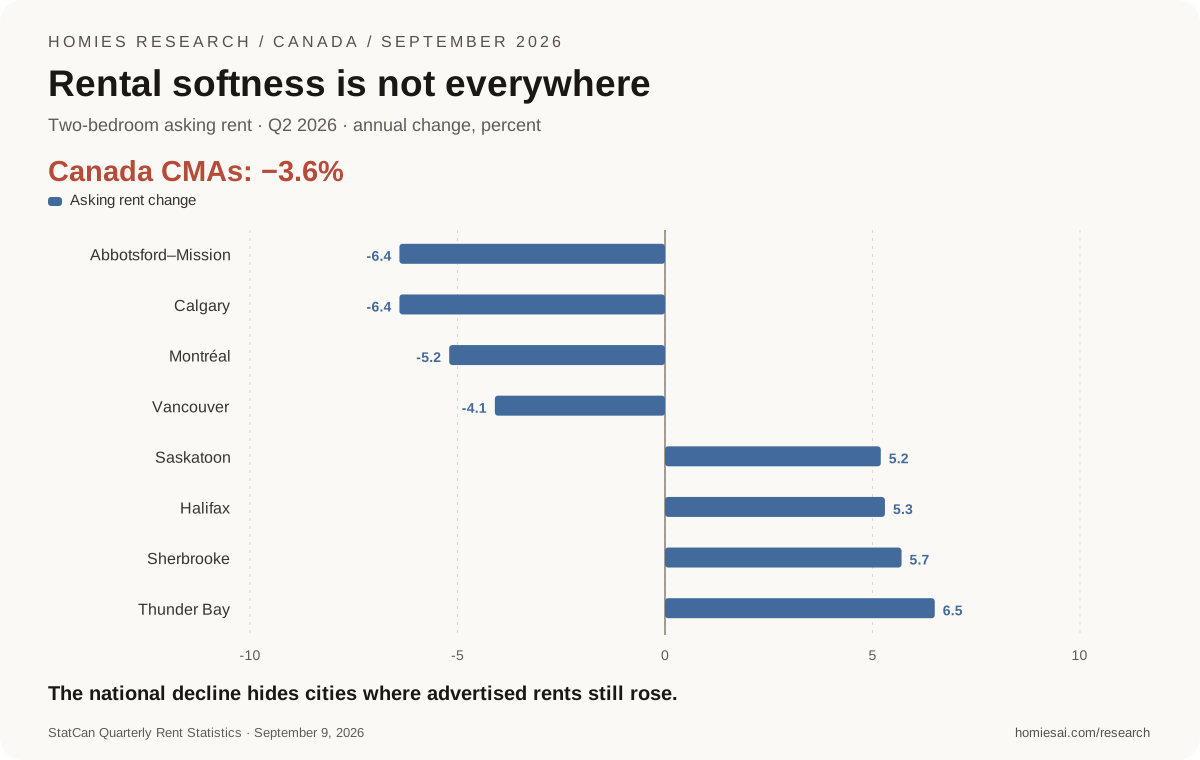
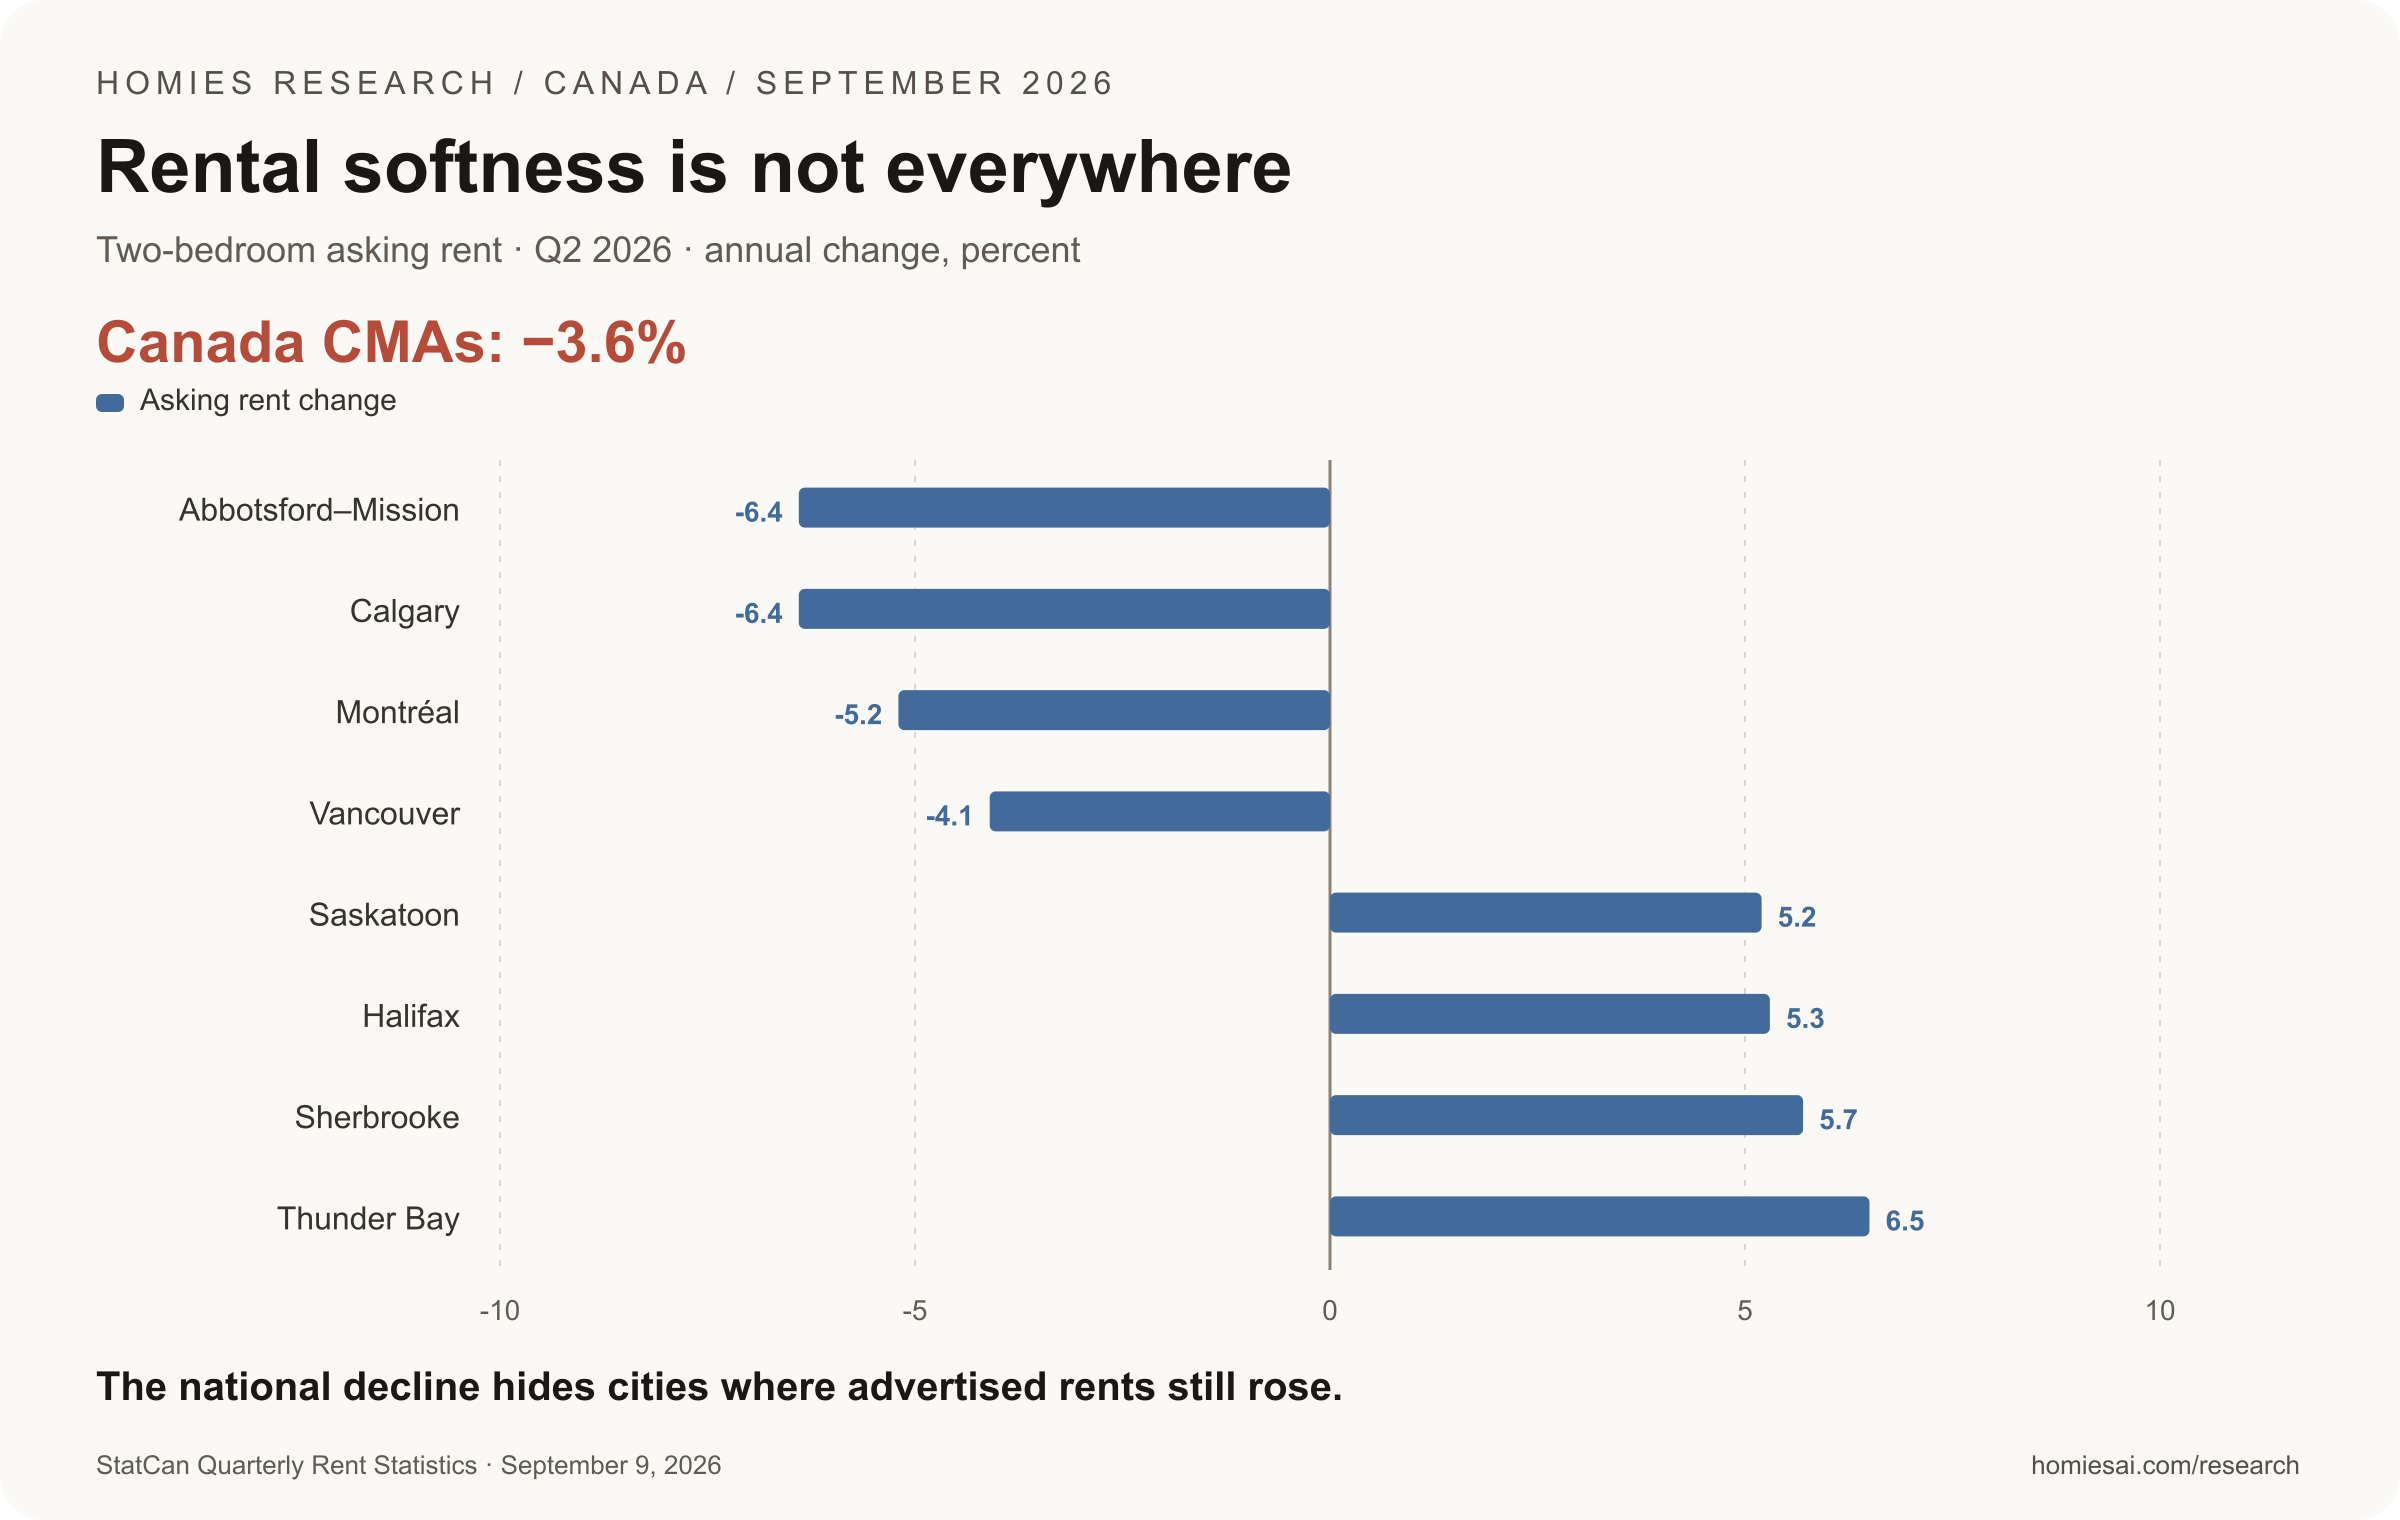
Experimental listing-based estimates; primary and secondary rentals. Composition is not held constant. All-CMA average: $2,130/month.
Source: StatCan Quarterly Rent Statistics · September 9, 2026. Research cutoff: September 30, 2026.
View exact values and units
| Period / group | Asking rent change (%) |
|---|---|
| Abbotsford–Mission | -6.4 |
| Calgary | -6.4 |
| Montréal | -5.2 |
| Vancouver | -4.1 |
| Saskatoon | 5.2 |
| Halifax | 5.3 |
| Sherbrooke | 5.7 |
| Thunder Bay | 6.5 |
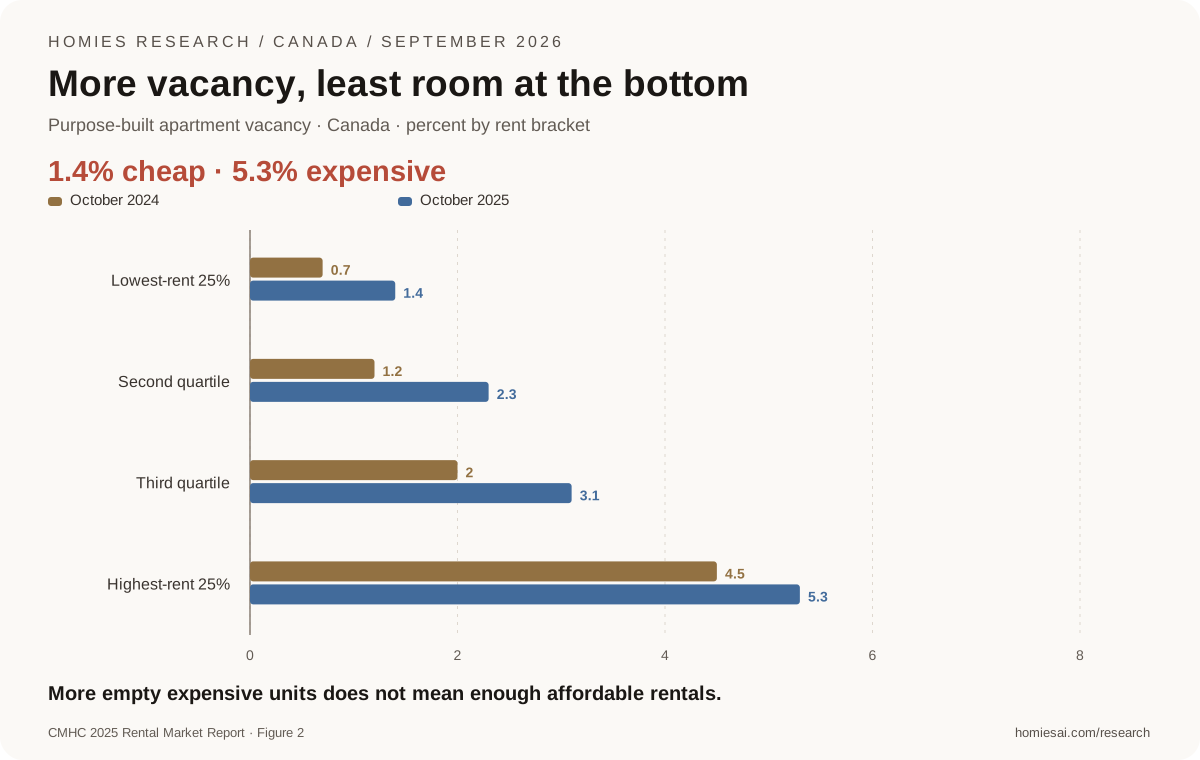
Quartiles are rent brackets, not calendar quarters. National purpose-built vacancy: 2.2% in 2024 → 3.1% in 2025. Not all homes.
Source: CMHC 2025 Rental Market Report · Figure 2. Research cutoff: September 30, 2026.
View exact values and units
| Period / group | October 2024 (%) | October 2025 (%) |
|---|---|---|
| Lowest-rent 25% | 0.7 | 1.4 |
| Second quartile | 1.2 | 2.3 |
| Third quartile | 2 | 3.1 |
| Highest-rent 25% | 4.5 | 5.3 |
Chapter 06 / Housing research
People become housing demand through households and budgets
The temptation is to divide 301,008 people by an average household size and announce a new housing deficit. That produces a scenario, not an observed requirement. At two people per dwelling, the arithmetic is 150,504 dwelling equivalents; at four, it is 75,252. Neither calculation establishes additional demand created in September, because the revised residents could already occupy existing homes, share with roommates or live with relatives.
Statistics Canada’s 2021 Census occupancy analysis shows why one coefficient is inadequate. It counted 316 rented units primarily maintained by NPRs per 1,000 NPRs, compared with 126 for Canadian-born residents. Work-permit holders and study-permit holders also had different observed occupancy patterns. These are group-specific occupancy measures with mixed-household limitations, not universal conversions from people into units. [11]
The roommate analogy captures the mechanism. Four people sharing a dwelling count as four residents but do not necessarily bid for four separate homes. If their incomes rise or a household separates, demand for additional units can increase without national population growth. Conversely, job losses or higher rents can force households to combine. Observed crowding can suppress household formation; it should not be mistaken for everyone’s preferred housing arrangement.
Statistics Canada’s newer cohort framework also accounts for people transitioning from temporary to permanent residency. Someone becoming a permanent resident may already be housed in Canada. Counting that person once as a temporary resident and again as a new permanent-resident housing need double counts the same resident. The framework models occupancy under assumptions, rather than predicting market prices. [12]
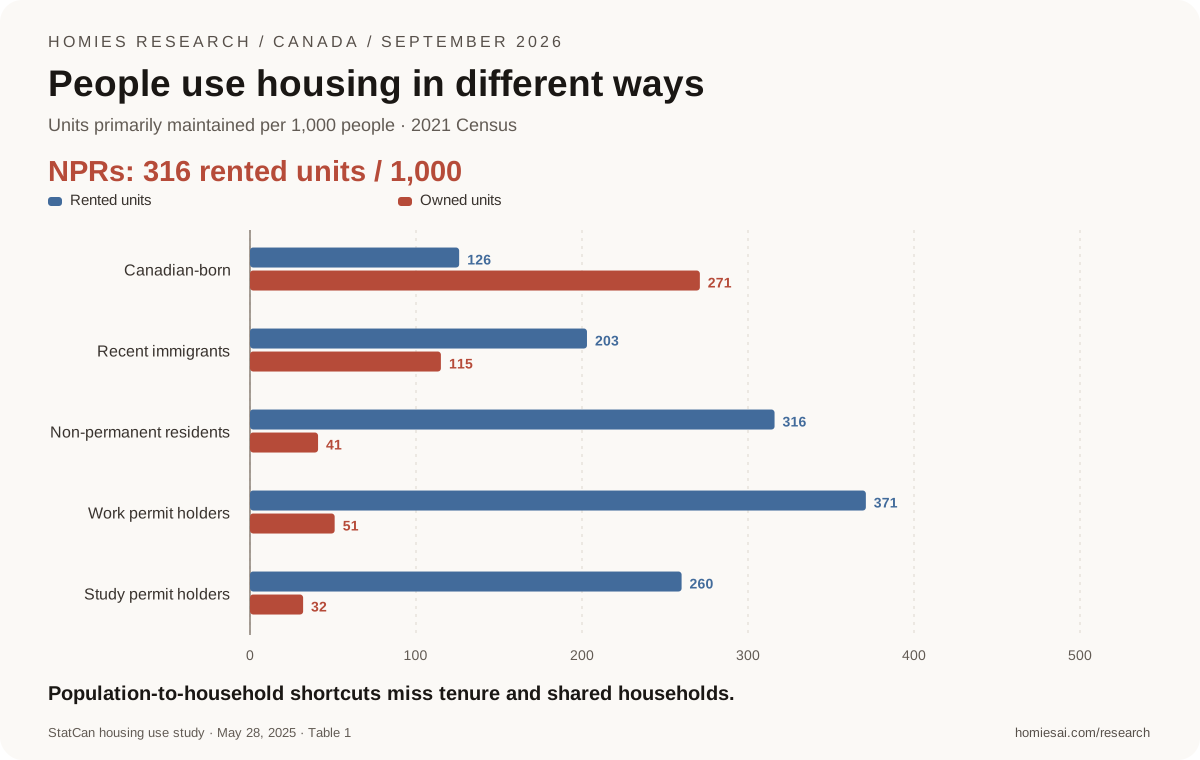
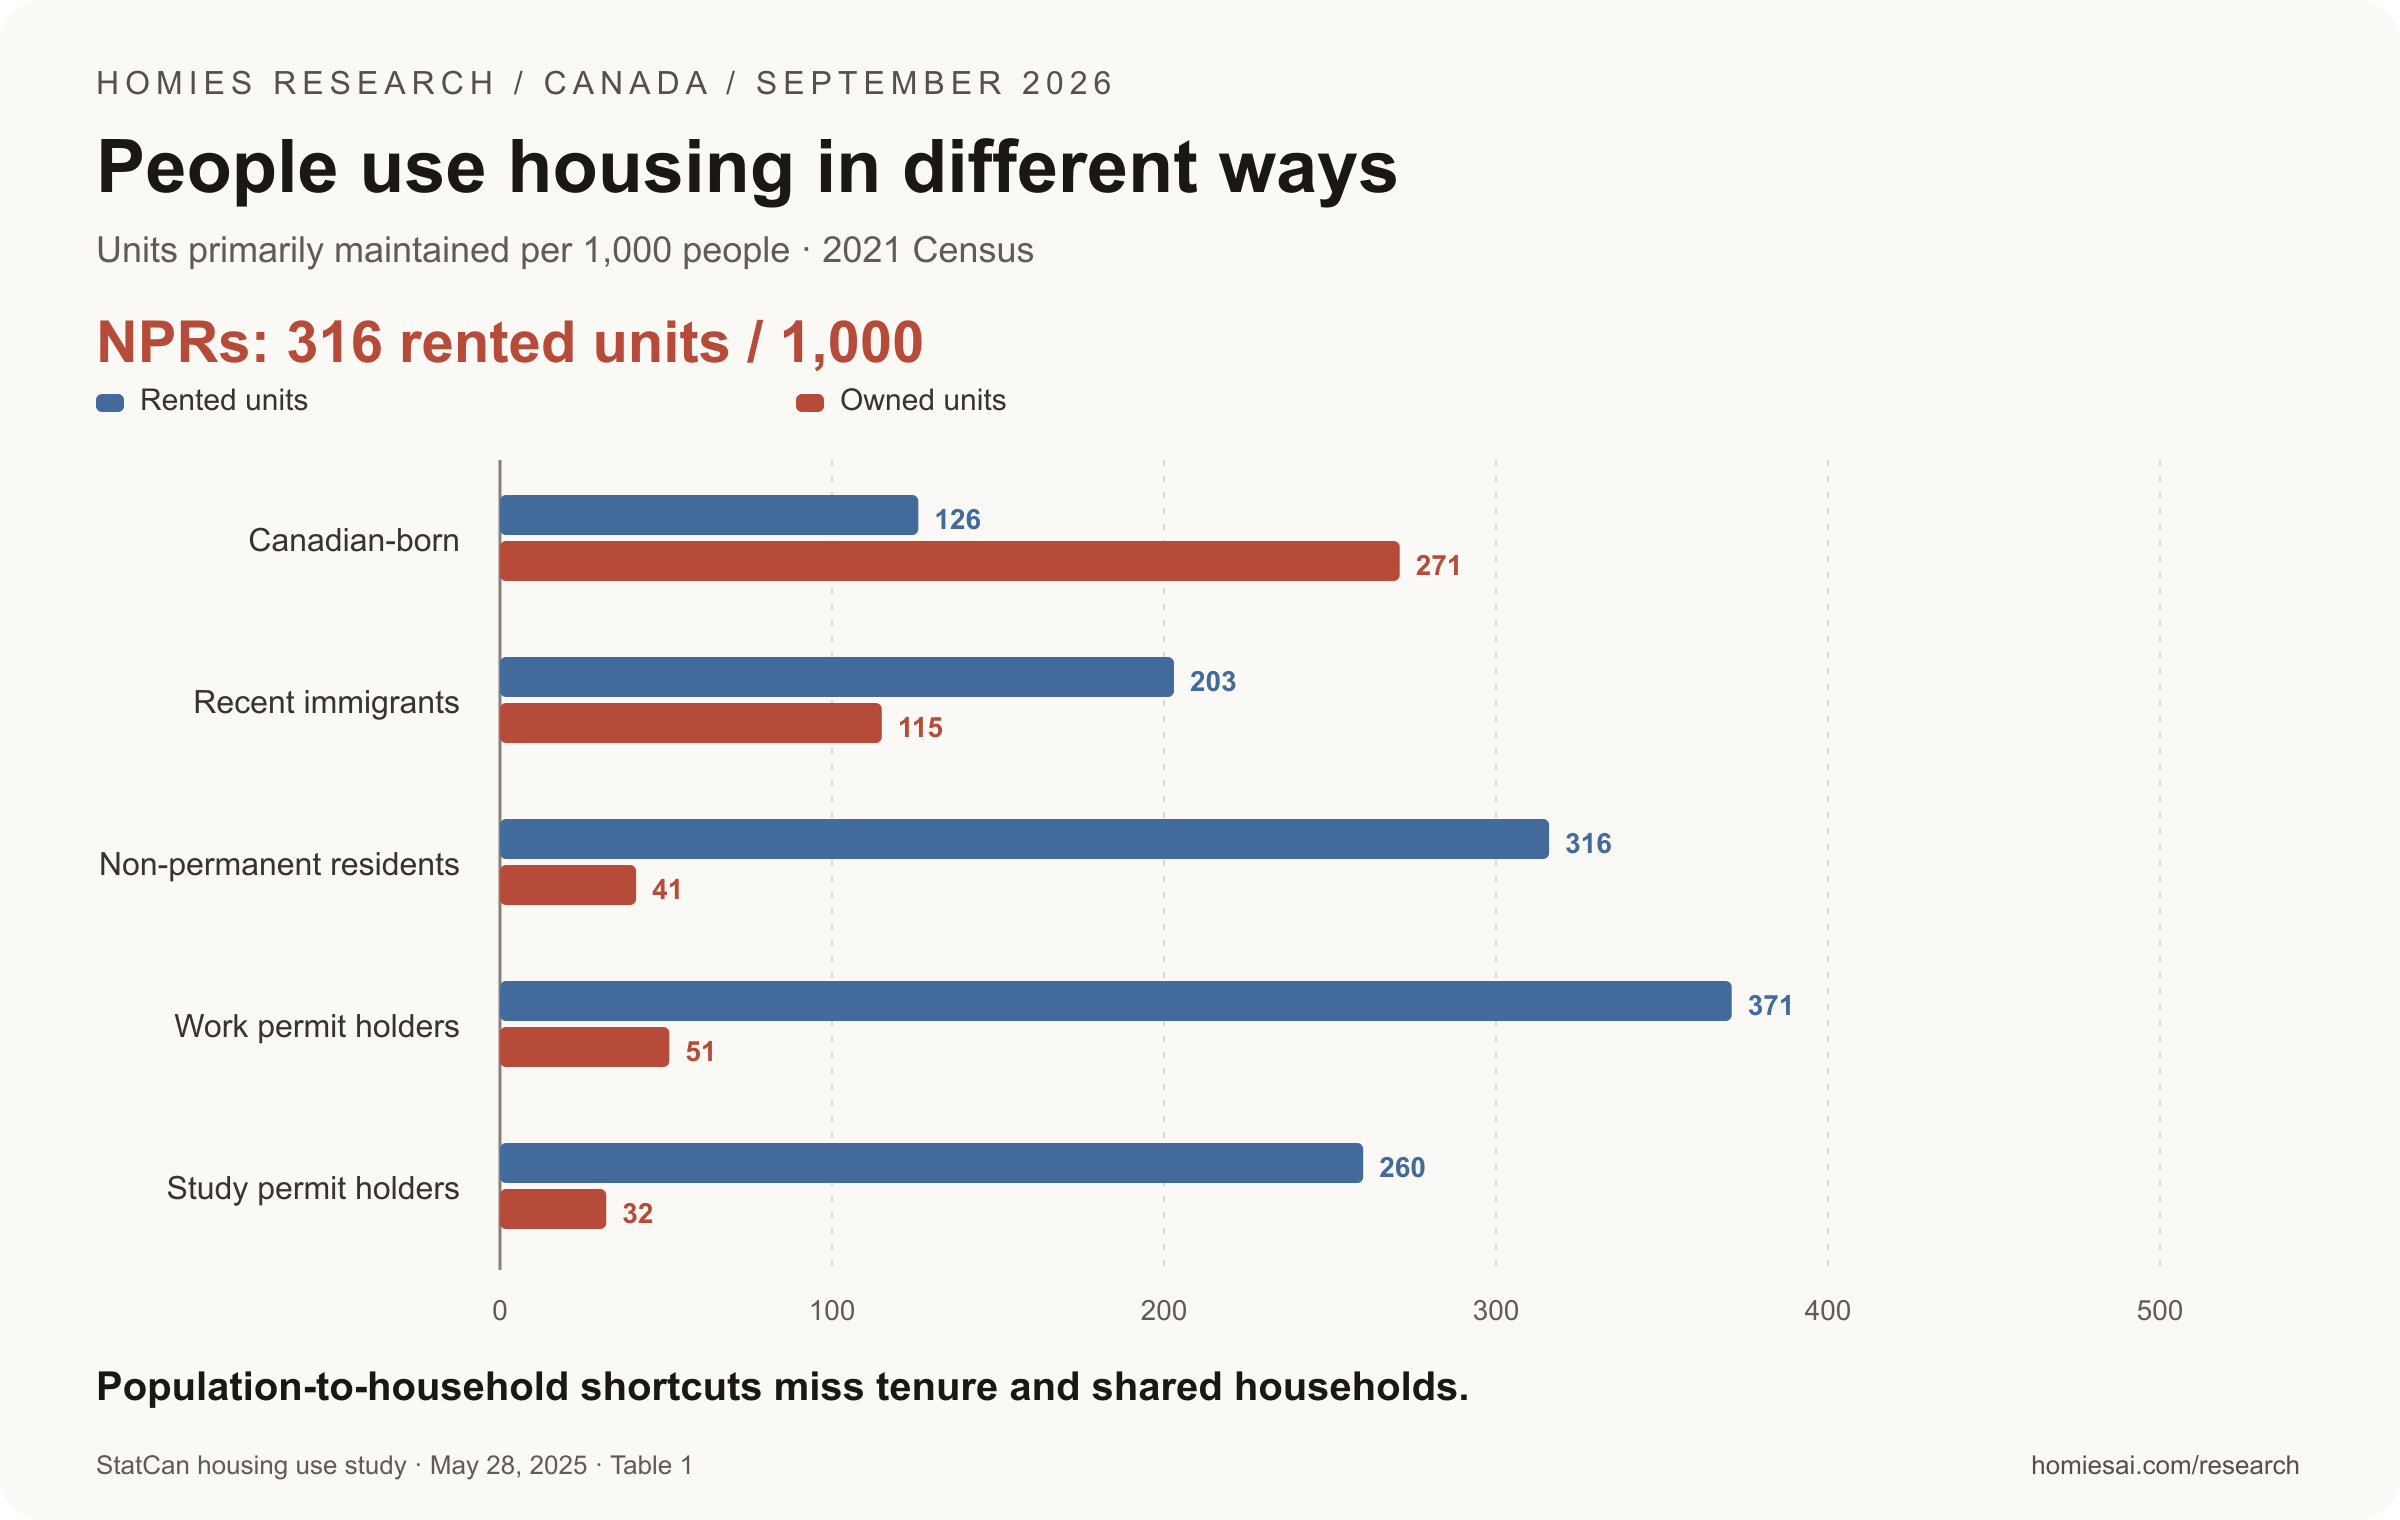
Historical observed occupancy, not unconstrained need or a marginal forecast coefficient. Work/study categories are subsets of NPRs; mixed households matter.
Source: StatCan housing use study · May 28, 2025 · Table 1. Research cutoff: September 30, 2026.
View exact values and units
| Period / group | Rented units (units / 1,000) | Owned units (units / 1,000) |
|---|---|---|
| Canadian-born | 126 | 271 |
| Recent immigrants | 203 | 115 |
| Non-permanent residents | 316 | 41 |
| Work permit holders | 371 | 51 |
| Study permit holders | 260 | 32 |
Chapter 07 / Housing research
Today’s condo competition can coexist with tomorrow’s supply risk
The condominium market needs two timelines. Homes completing today originate in earlier investment decisions. Projects that fail to launch today cannot deliver homes years from now. Population revisions change neither timeline directly. They change the baseline against which developers, lenders and planners assess demand, while financing and project economics determine whether construction proceeds.
Urbanation’s Q2 2026 GTHA survey recorded a combined pre-construction and under-construction condominium pipeline of 48,710 units, down 37% year over year. Quarterly condo construction starts were 448 units, with 1,022 cancellations. Those are different measures: pipeline is a stock; starts and cancellations are quarterly flows. The survey’s warning about later undersupply is an industry interpretation, not proof that future prices must rise. [15]
CMHC’s August national six-month housing-starts trend was 244,149 units at a seasonally adjusted annual rate. That is an annualized pace, not an observed year of completed homes. Its separate pipeline figures for centres with at least 50,000 residents showed 142,423 permitted units awaiting starts and 371,658 under construction; 17,550 units completed during August. Stocks and monthly flows belong in distinct chart stages, not a funnel implying a conversion rate. [14]
The Fall 2026 CMHC affordability scenario estimates 417,000–469,000 annual starts would be required to restore 2019 affordability by 2036, against a 231,000 business-as-usual path. These are model scenarios, not a government commitment or a count of immediately missing dwellings. The model nevertheless challenges the idea that slower population growth automatically eliminates the supply problem. We have not verified that it incorporates September’s population-method changes. [13]
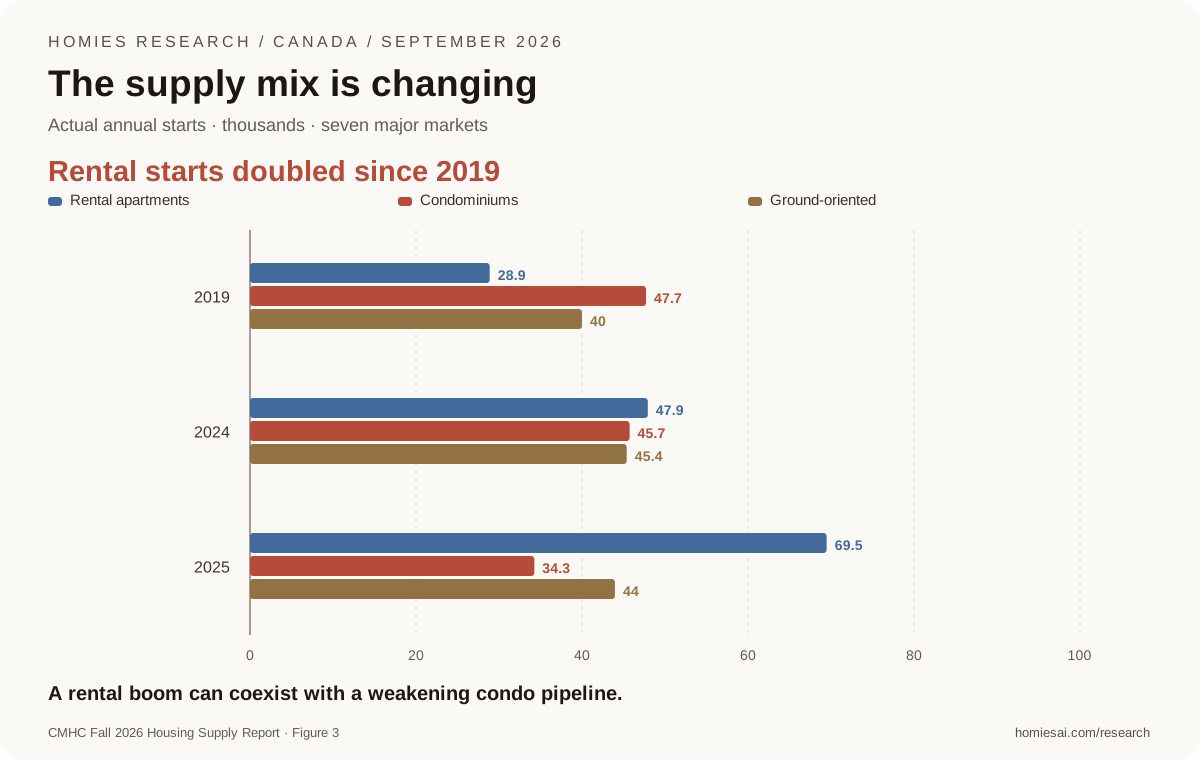
Vancouver, Calgary, Edmonton, Toronto, Ottawa, Montréal and Halifax—not Canada totals. Starts are not completions.
Source: CMHC Fall 2026 Housing Supply Report · Figure 3. Research cutoff: September 30, 2026.
View exact values and units
| Period / group | Rental apartments (thousand units) | Condominiums (thousand units) | Ground-oriented (thousand units) |
|---|---|---|---|
| 2019 | 28.877 | 47.719 | 39.989 |
| 2024 | 47.929 | 45.737 | 45.385 |
| 2025 | 69.475 | 34.259 | 43.967 |
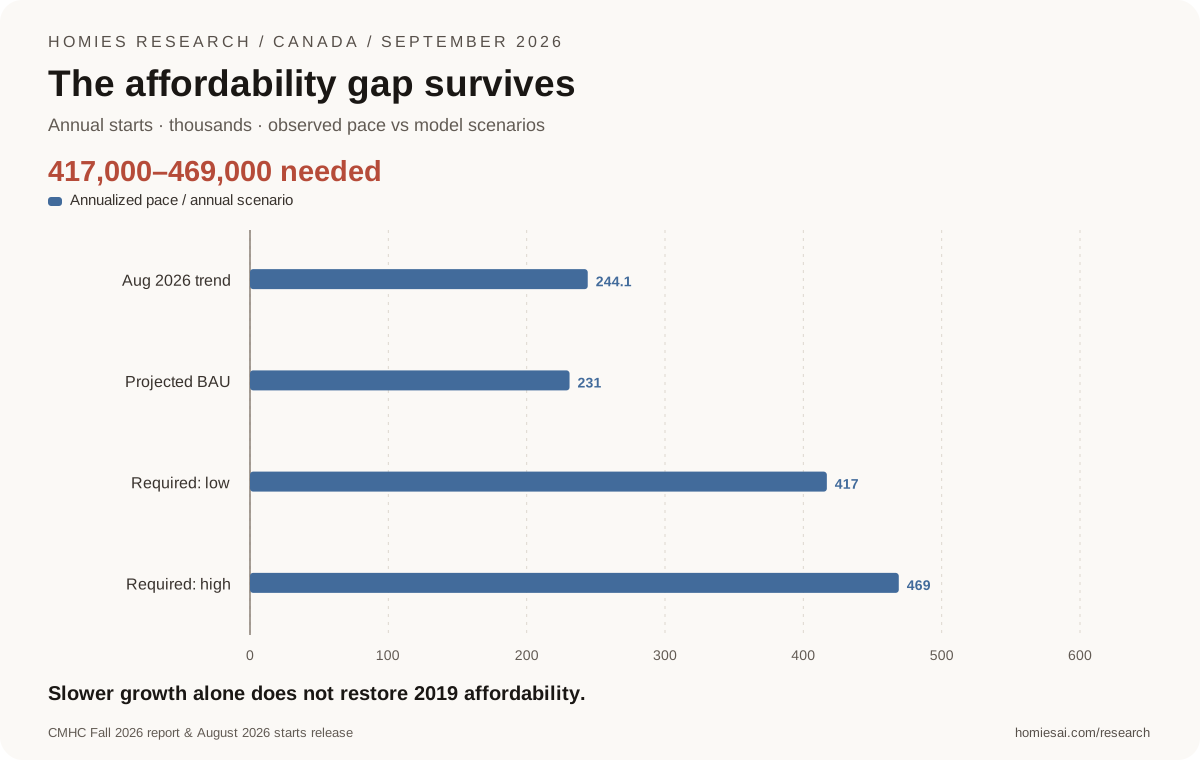
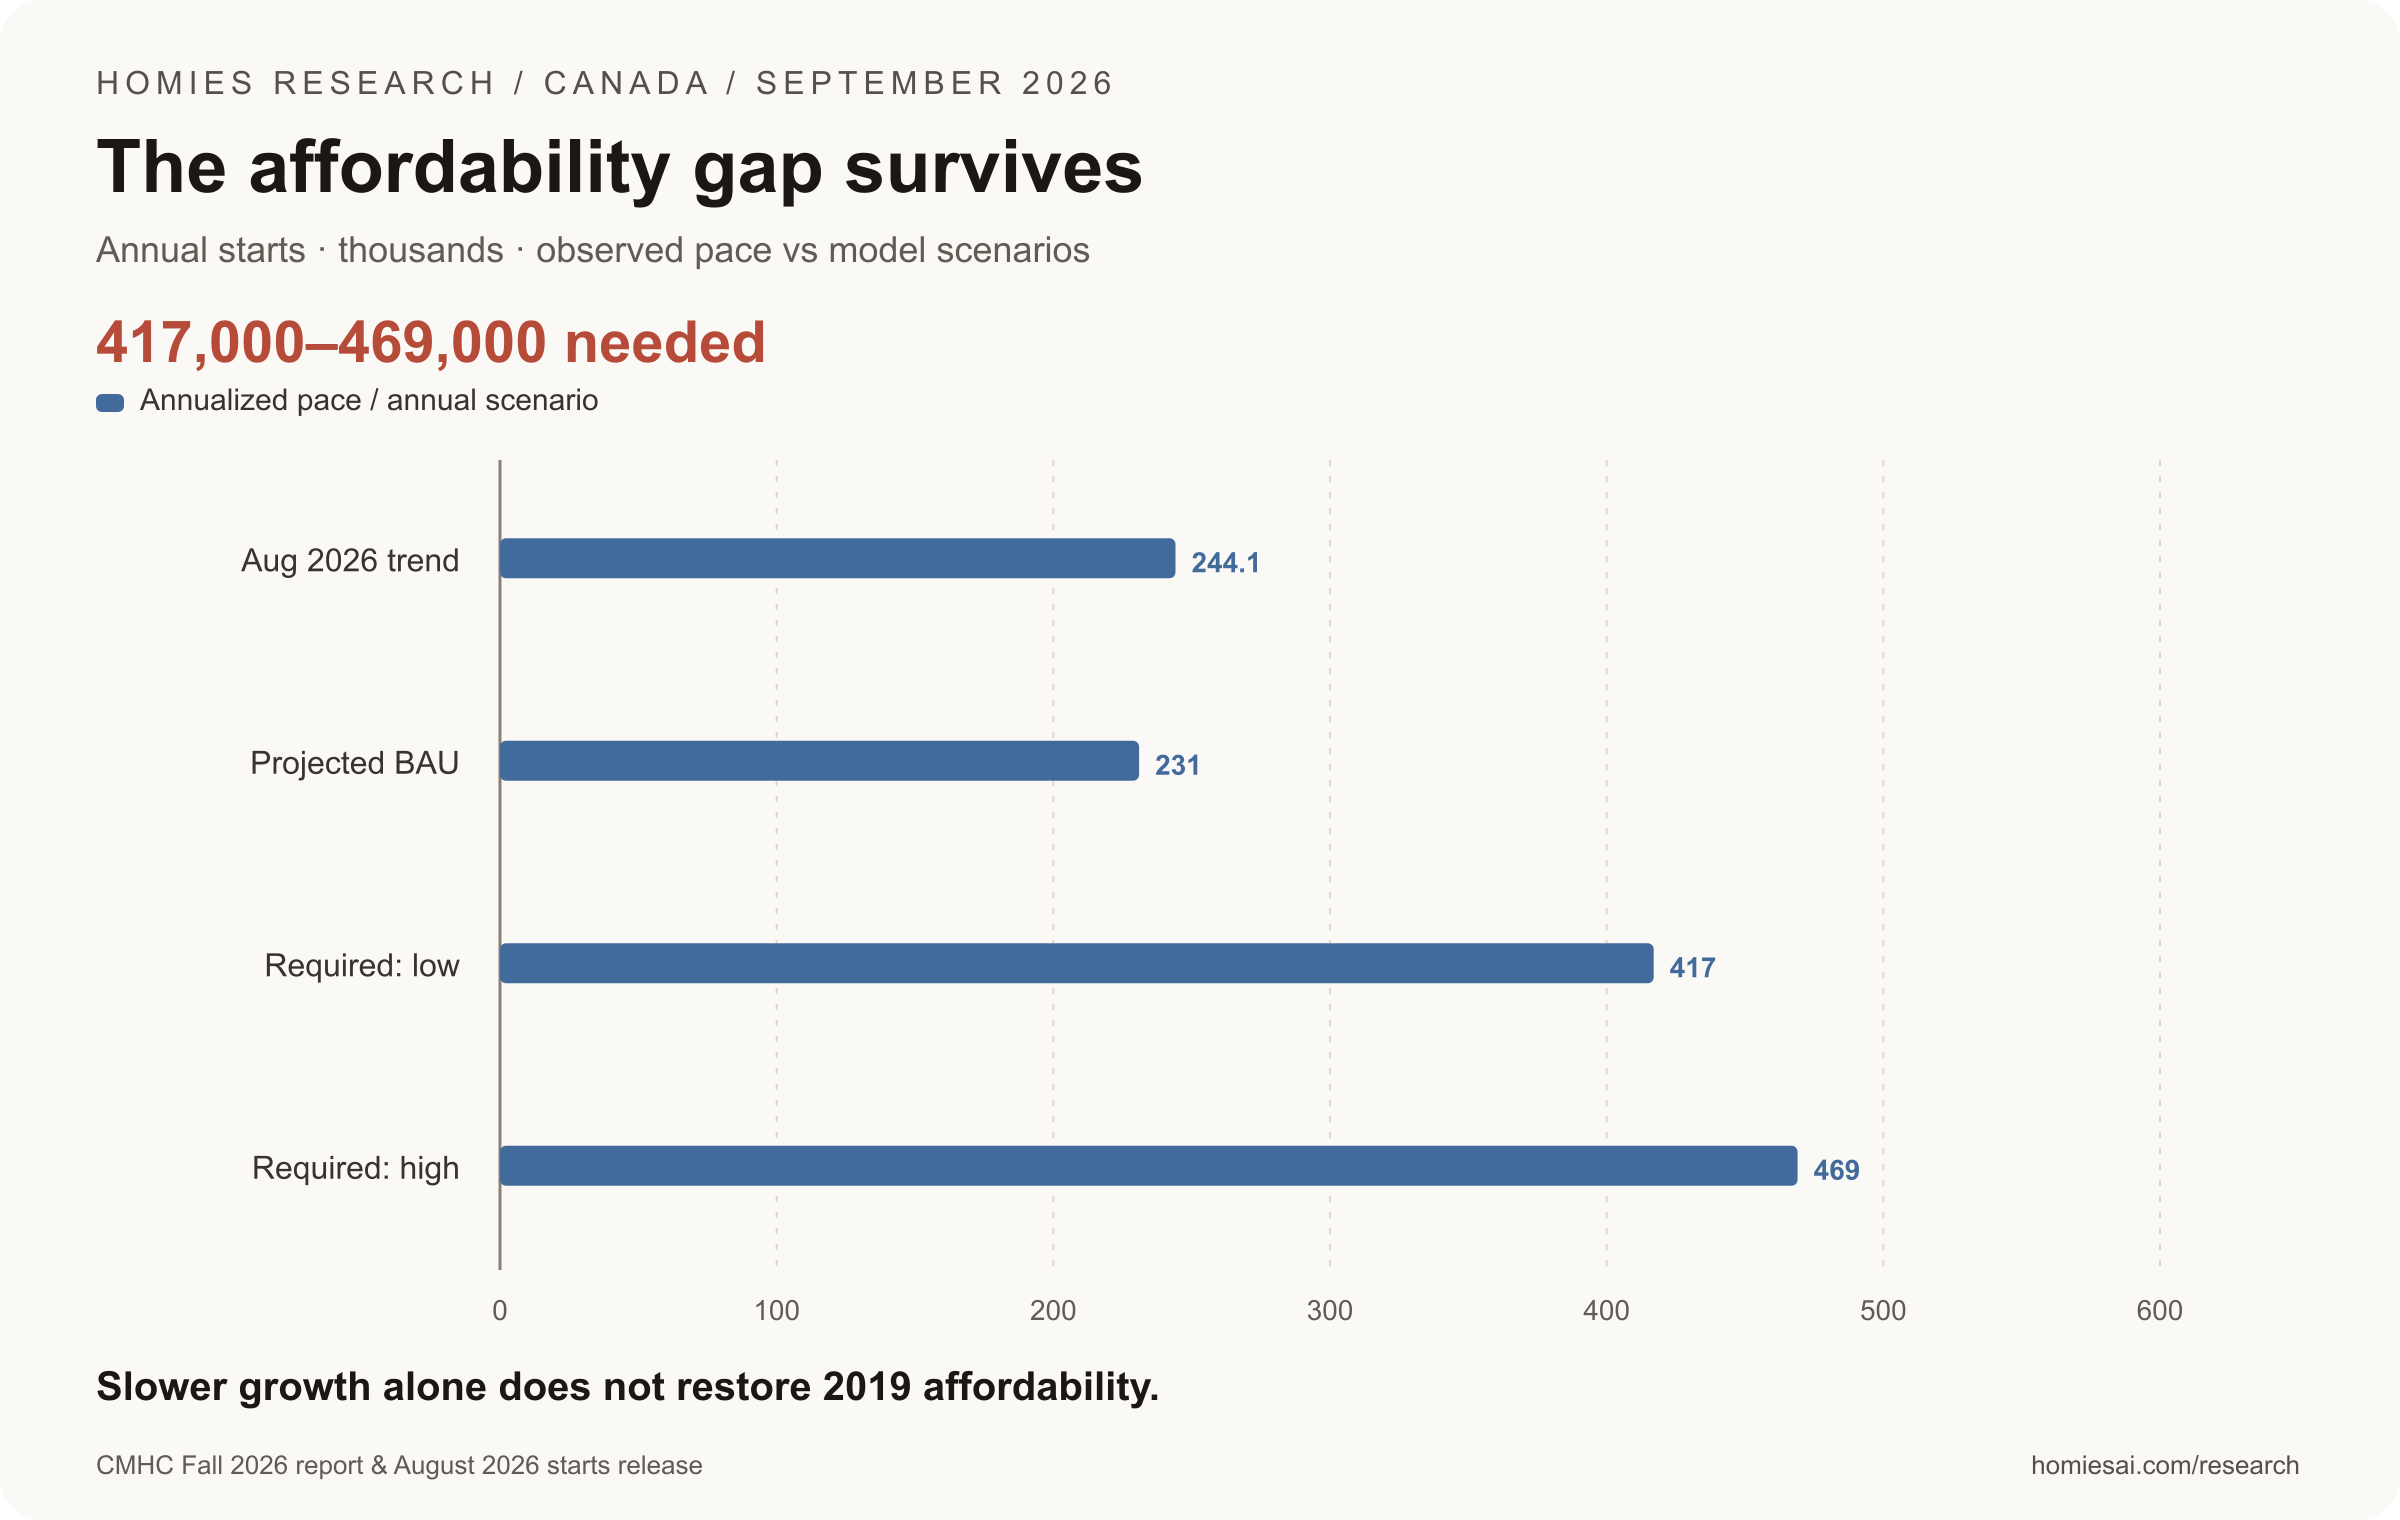
August is six-month trend SAAR, not an actual yearly total. BAU/required are 2036 affordability scenarios. Model incorporation of Sep population revision unconfirmed.
Source: CMHC Fall 2026 report & August 2026 starts release. Research cutoff: September 30, 2026.
View exact values and units
| Period / group | Annualized pace / annual scenario (thousand units) |
|---|---|
| Aug 2026 trend | 244.149 |
| Projected BAU | 231 |
| Required: low | 417 |
| Required: high | 469 |
Chapter 08 / Housing research
Alberta’s growth and construction differ from Toronto’s
A national demographic headline cannot describe every Canadian housing market. In the latest July-to-July population estimates, Alberta added 76,419 people, Ontario 45,160, Quebec 16,092 and British Columbia 8,054. Relative to each province’s July 2025 base, those changes are approximately 1.52%, 0.28%, 0.18% and 0.14%. Alberta’s larger percentage gain changes the interpretation of its absolute growth. Provincial figures still cannot identify demand in a particular neighbourhood. [2]
CMHC’s first-half 2026 starts per 10,000 residents were 61 in Calgary and 51 in Edmonton, compared with 19 in Toronto and 41 in Vancouver. Its affordability scenario assigns annual start gaps of 20,000–26,000 to Toronto and 42,000–56,000 to Montréal, versus 4,000–5,000 to Calgary and zero to Edmonton. The zero refers to a modelled benchmark; it does not establish universal affordability. [13]
Use those comparisons to ask better local questions. Is population growth arriving where construction can respond? Are new homes the size and tenure that households need? Is rental competition concentrated in newly completed buildings while family-sized freehold inventory remains limited? A city with rapid construction and population growth can behave differently from a city with a weak development pipeline. Equally, a condominium-heavy submarket can soften while a nearby freehold market remains constrained. This is why a national correction cannot produce a uniform price conclusion.
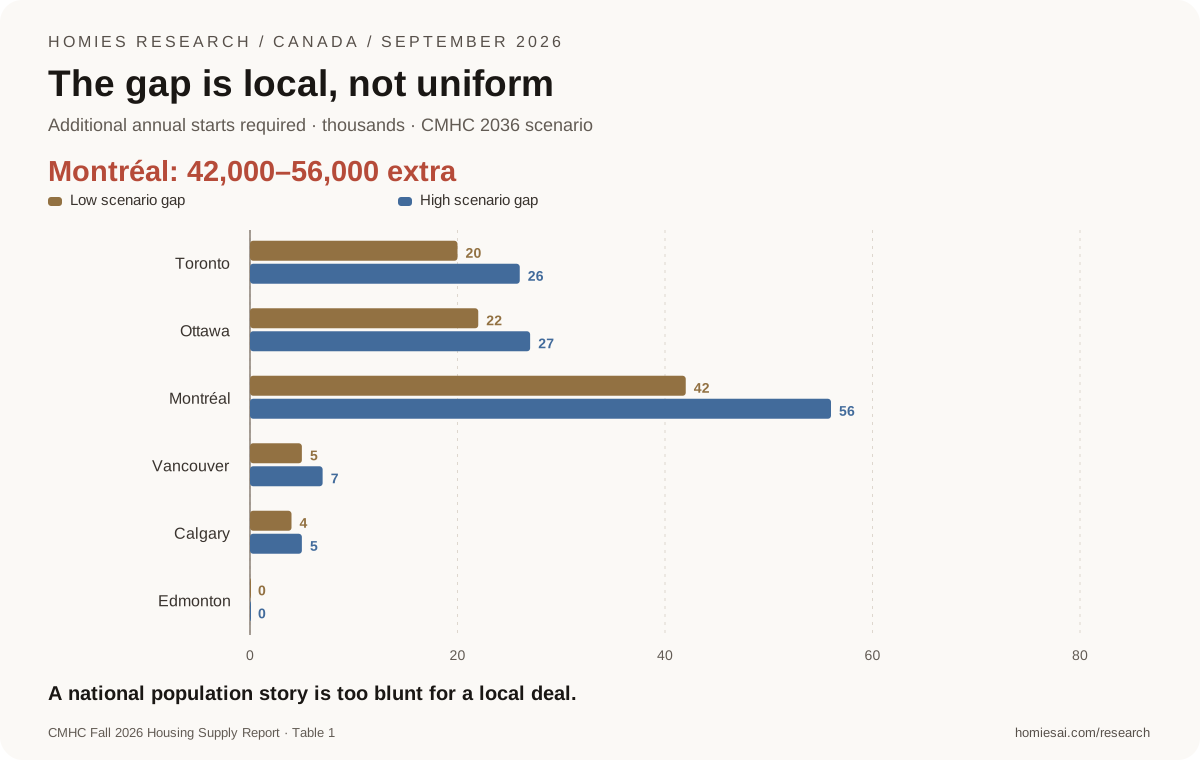
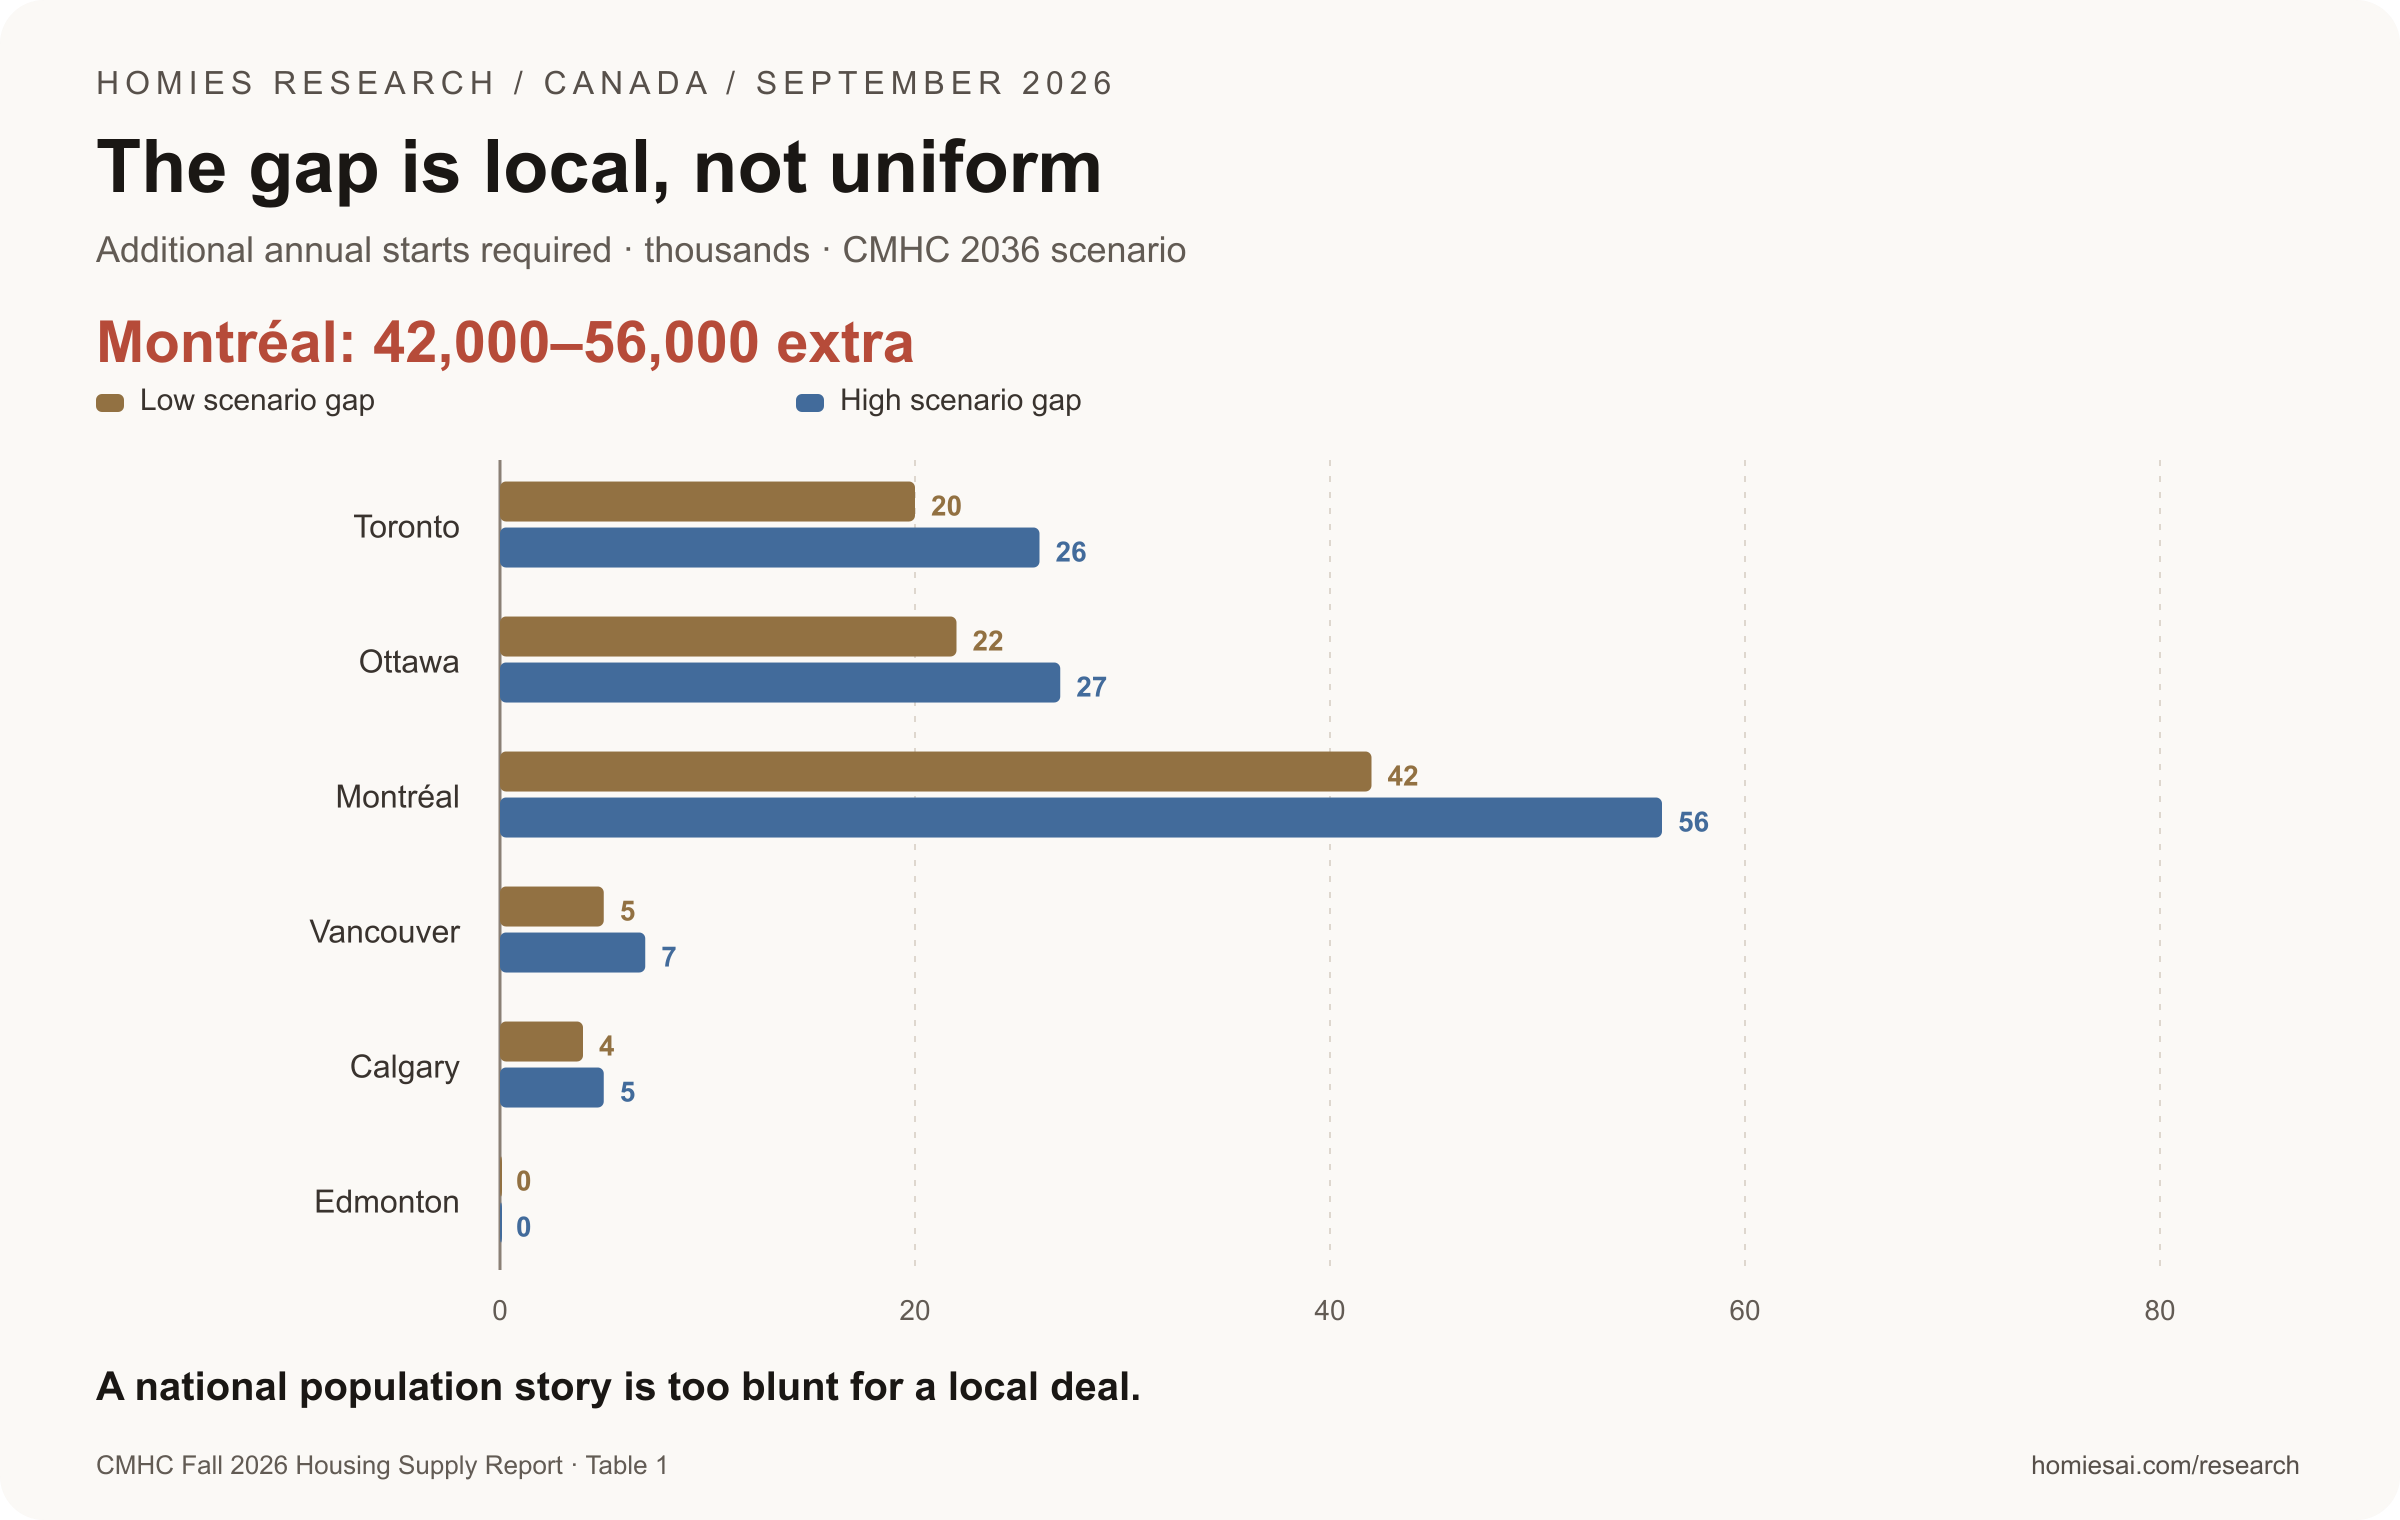
CMA geographies; rounded model figures, not forecasts of prices. Zero for Edmonton means no modeled gap to the benchmark—not universal affordability.
Source: CMHC Fall 2026 Housing Supply Report · Table 1. Research cutoff: September 30, 2026.
View exact values and units
| Period / group | Low scenario gap (thousand units) | High scenario gap (thousand units) |
|---|---|---|
| Toronto | 20 | 26 |
| Ottawa | 22 | 27 |
| Montréal | 42 | 56 |
| Vancouver | 5 | 7 |
| Calgary | 4 | 5 |
| Edmonton | 0 | 0 |
Chapter 09 / Housing research
The temporary-resident target is a share, not a departure count
The current 2026–2028 Immigration Levels Plan aims to reduce temporary residents to less than 5% of the population by the end of 2027. Its new-arrival targets exclude extensions, certain in-Canada applications and asylum claimants. Those definitions differ from Statistics Canada’s NPR stock, so policy arrival targets and demographic stock estimates should not be treated as interchangeable. [16]
At July’s total population of 41,798,407, exactly 5% is approximately 2,089,920 people. Compared with the NPR estimate of 2,779,774, that leaves an illustrative gap of about 689,854 with the denominator held fixed. It is not a forecast that 690,000 people must leave. Transitions into permanent residency can reduce the temporary-resident numerator without a departure, and population changes alter the denominator. “Less than 5%” also differs from exactly 5%. [2][6][16]
The housing implication is conditional. A smaller temporary-resident stock can reduce rental pressure; fewer new arrivals can reduce incremental household formation. But a legal-status transition can leave a renter, worker and household in the same city. Evaluating policy requires tracking actual residents, households and outcomes, rather than treating every change in an immigration category as a physical move.
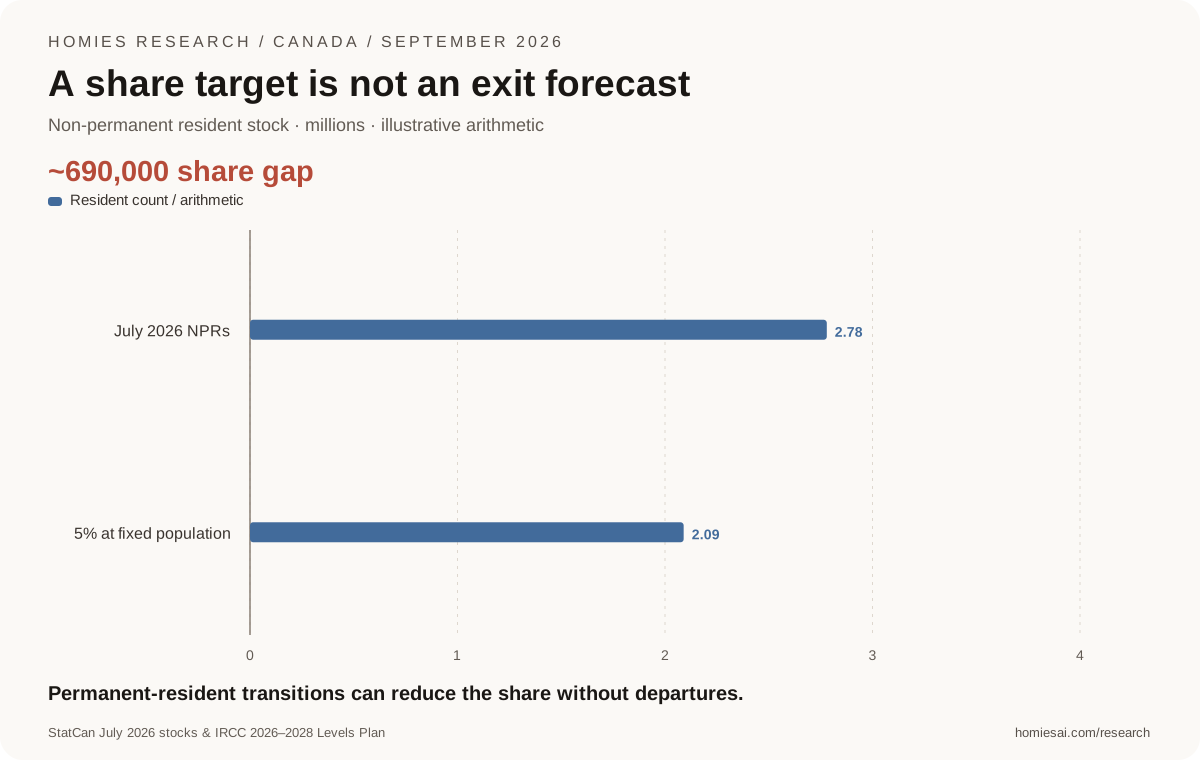
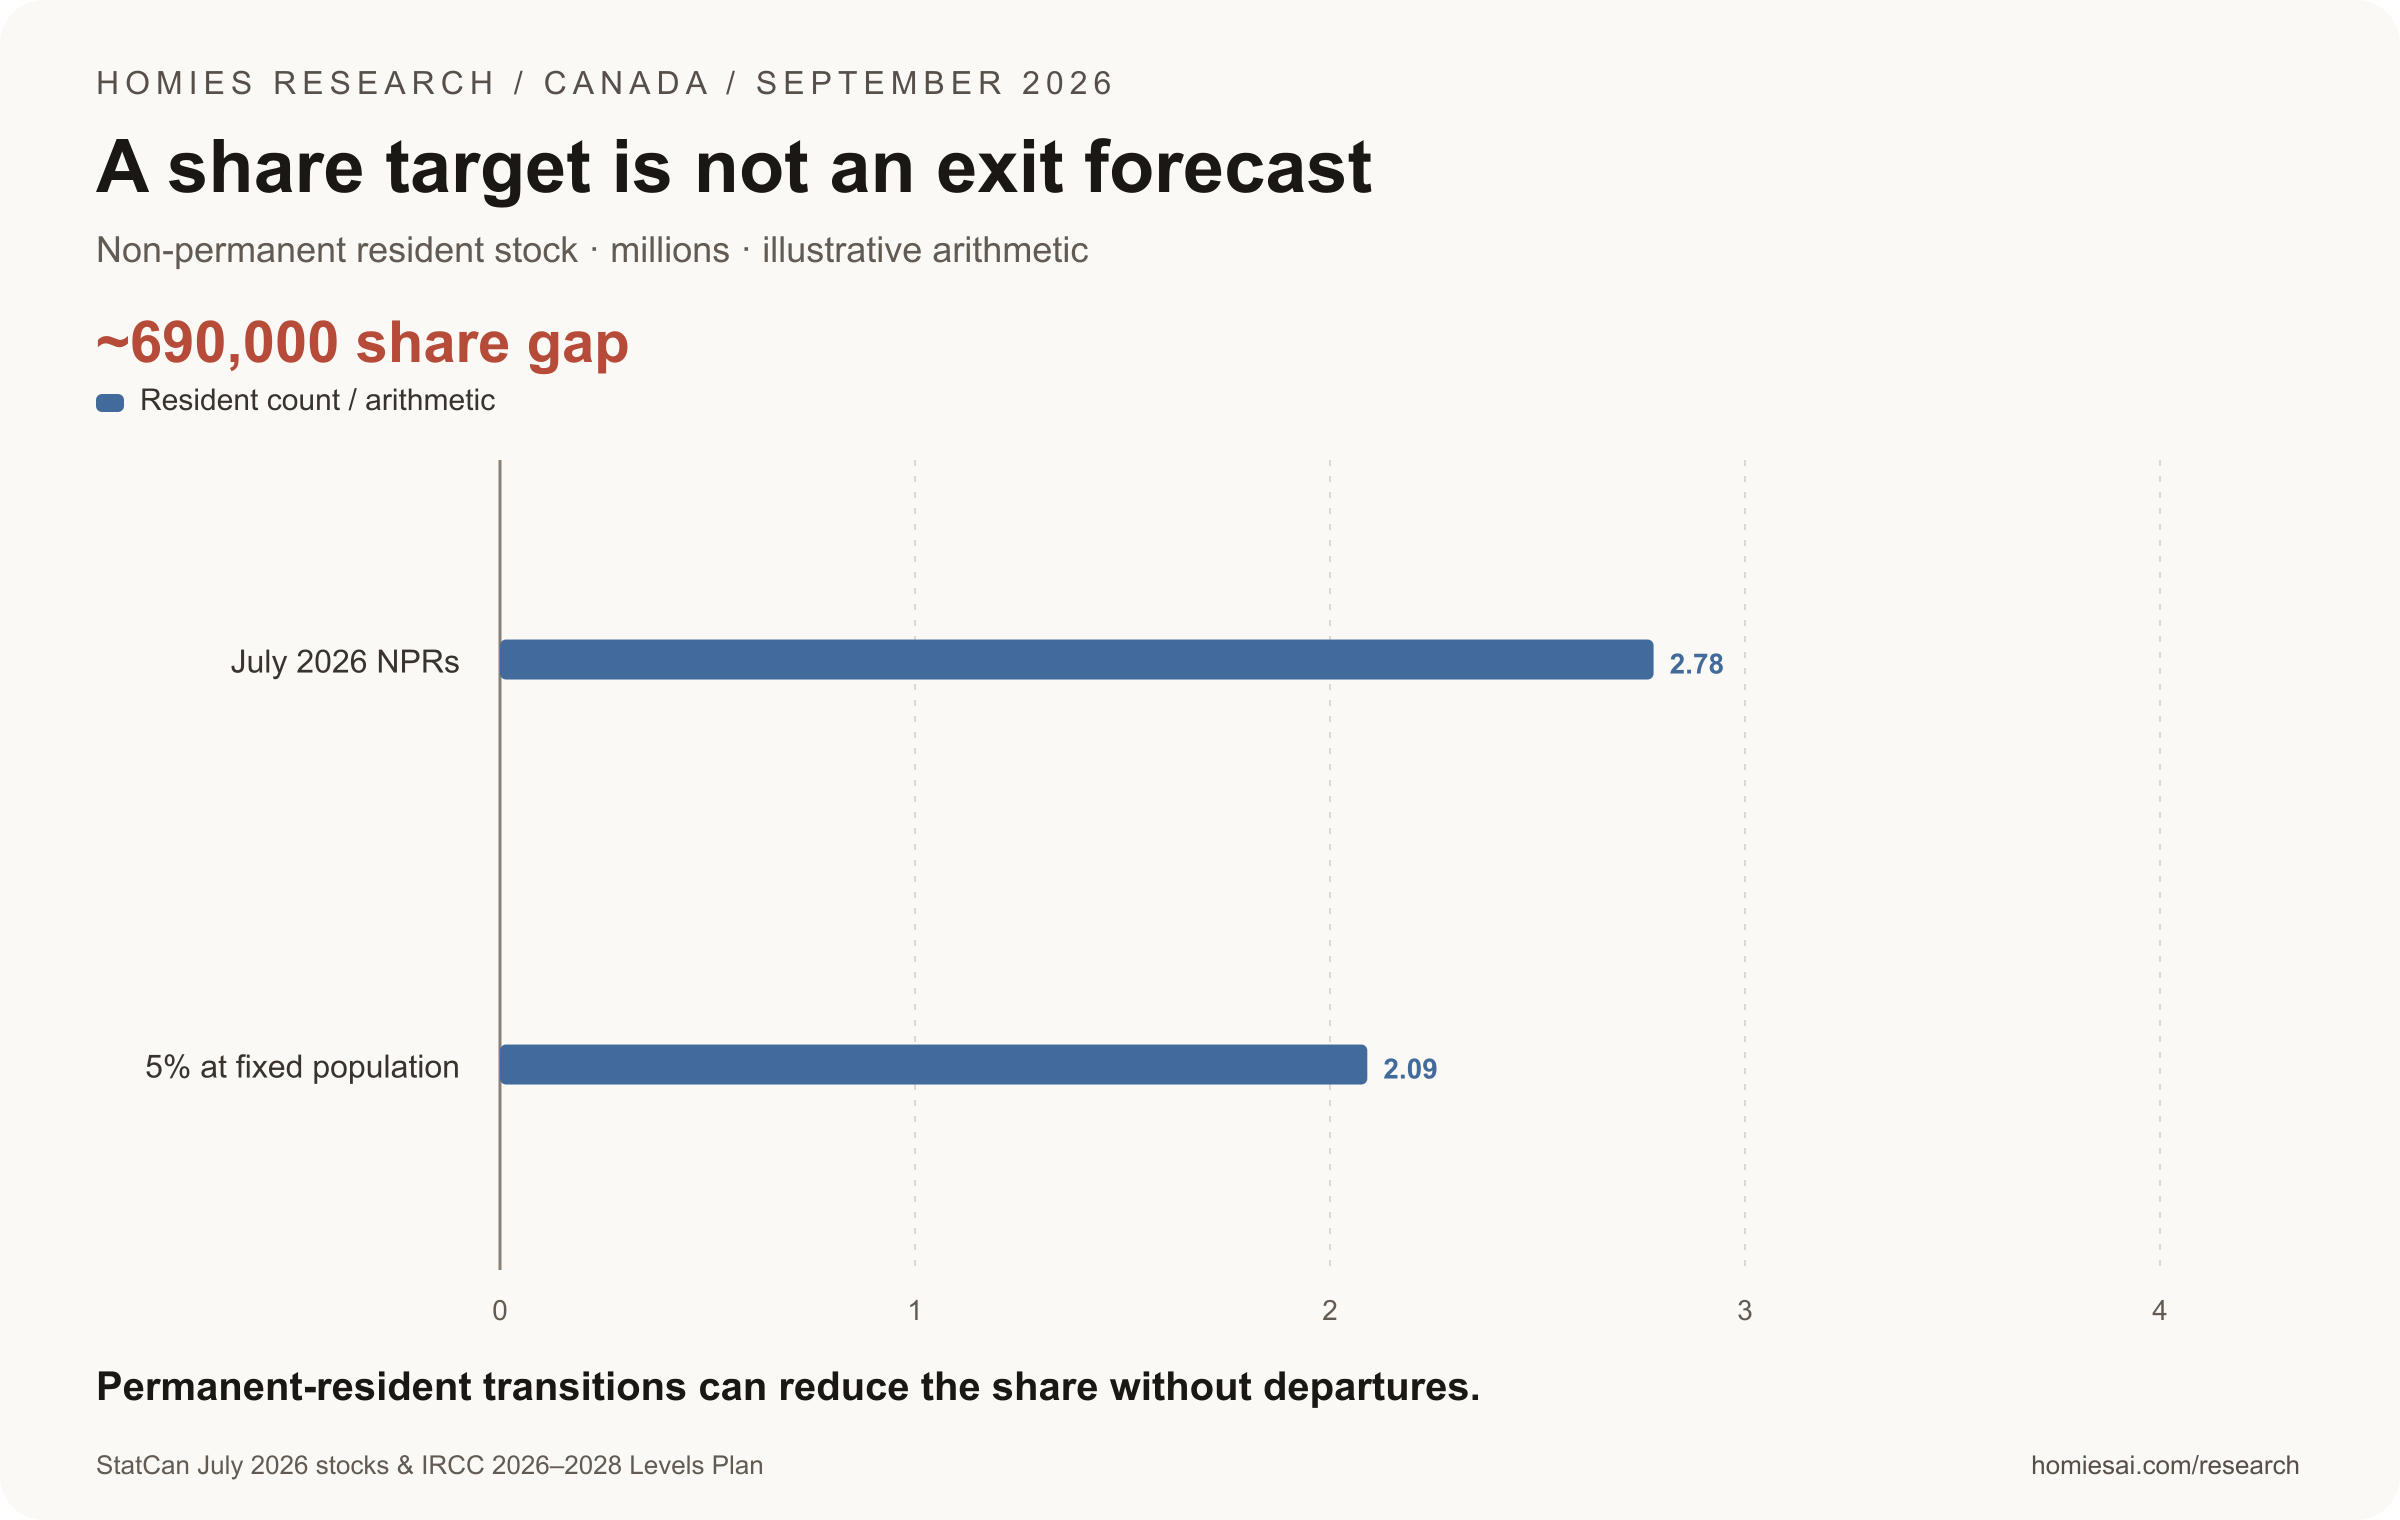
5% × 41,798,407; illustrative fixed denominator. Current policy aims below 5% by end-2027. Not 690,000 people required to leave.
Source: StatCan July 2026 stocks & IRCC 2026–2028 Levels Plan. Research cutoff: September 30, 2026.
View exact values and units
| Period / group | Resident count / arithmetic (million) |
|---|---|
| July 2026 NPRs | 2.779774 |
| 5% at fixed population | 2.08992 |
Chapter 10 / Housing research
Watch household purchasing power before predicting prices
Renters should compare current listings, incentives and total monthly costs in their own submarket. Landlords should monitor vacancy duration, qualified applications and effective rent after concessions. Condominium buyers should assess building finances, competing supply and realistic carrying costs alongside transaction prices. Freehold buyers should examine local inventory, income stability and financing affordability. Those observations test the market mechanisms that a national population revision cannot settle.
The central distinction is people versus people with the income and financing to form independent households. Population provides a demand base. Employment, wages, credit conditions and preferences shape how that base becomes leases and purchases. The Bank of Canada’s mechanism analysis explains why newcomers initially affect rentals and why housing supply responds slowly; it is useful background, not a current price forecast. [18]
Do not infer a mechanical rise in unemployment from the revised population. The unemployment rate is unemployed people divided by the labour force, not total residents. Nor does a falling age-band population prove a Canadian youth brain drain: ageing into and out of the group and temporary-resident changes can affect the stock. Both claims require additional evidence. The strongest conclusion supported here is narrower and more actionable: reassess the demographic baseline, keep the slowdown, and investigate the local market before drawing a price conclusion. [17]
Rental underwriting
Use achieved rents, concessions, lease-up and tenant incomes.
Condo pipeline
Distinguish today’s inventory from starts arriving years later.
Freehold demand
Track jobs, mortgage payments and local market balance.
Chapter 11 / Housing research
How to read the charts and reproduce the analysis
Research cutoff: September 30, 2026. Population and NPR chart series use the latest Statistics Canada table vintage downloaded at that cutoff. Historical preliminary observations come from the original December 2025, March 2026 and June 2026 releases. Quarterly changes are calculated from adjacent stocks within the same vintage. Annual comparisons specify their reference period; calendar-year growth and July-to-July growth are not interchangeable. [2][3][4][5][6]
Rental charts identify their survey date, sample and measure. CMHC’s October 2025 purpose-built vacancy survey, Statistics Canada’s Q2 2026 experimental listing estimates, and condominium-rental measures are separate datasets. Construction charts distinguish geography, stocks, monthly flows and annualized rates. Modelled supply gaps retain CMHC’s definitions and rounded published figures. The research identifies mechanisms and descriptive associations; it does not isolate the causal effect of immigration policy or estimate a price response to the revision.
Canada population & housing
Questions answered
Did Statistics Canada find 300,000 new people in September 2026?
It revised the estimated number living in Canada on April 1, 2026 upward by 301,008. That compares two estimates of the same date, not arrivals between June and September.
Did Canada’s population shrink in 2025?
The September vintage shows calendar 2025 growth of 280,810. The fourth quarter still declined by 7,225, so the answer depends on the period.
Does the revision mean Canadian house prices will rise?
No price response follows mechanically. Residents were already participating in the market; local supply, household incomes and financing determine transactions.
Are Canadian rents falling?
Statistics Canada’s Q2 2026 all-CMA two-bedroom asking-rent estimate fell 3.6% year over year. Conditions differ across cities and asking rents are distinct from average rents paid.
Does Canada need 690,000 temporary residents to leave?
That figure is an illustrative gap to exactly 5% with total population held fixed. Permanent-resident transitions and denominator changes can alter the share without that number of departures.
Evidence you can check
Sources, dates and downloads
Population vintage: September 23, 2026. Research cutoff: September 30, 2026. Housing reference periods vary and appear on every chart. Sources support the measurements; housing implications are our analysis. The report was developed from Daniel Foch’s population-revision commentary and independently checked against the sources below.
- [1]Statistics Canada: September 2026 annual population release
- [2]Statistics Canada: quarterly population estimates, latest vintage
- [3]Statistics Canada: June 2026 preliminary population release
- [4]Statistics Canada: December 2025 preliminary release
- [5]Statistics Canada: March 2026 preliminary release
- [6]Statistics Canada: non-permanent resident estimates
- [7]Statistics Canada: population estimates technical guide, NPR methodology
- [8]IRCC: maintained status during work-permit extensions
- [9]Statistics Canada: Q2 2026 asking and paid rental estimates
- [10]CMHC: 2025 Rental Market Report
- [11]Statistics Canada: immigration and observed housing occupancy
- [12]Statistics Canada: cohort framework for immigration housing occupancy
- [13]CMHC: Fall 2026 Housing Supply Report
- [14]CMHC: August 2026 housing starts and construction pipeline
- [15]Urbanation: GTHA Q2 2026 new condominium survey
- [16]IRCC: 2026–2028 Immigration Levels Plan
- [17]Statistics Canada: Labour Force Survey guide
- [18]Bank of Canada: newcomers and housing supply mechanisms
- [19]Statistics Canada: Q2 2026 asking and paid rent chart data
Follow the monthly data in the Homies housing stats explorer.