Homies Research · RESCON 2026
A tale of two markets.
Canada’s housing market in 40 charts, from Daniel Foch’s talk at RESCON’s 6th annual online conference. Ontario and British Columbia are paying down an affordability debt; the affordable provinces are coming off records. Bond yields, oil and a slowing supply pipeline decide how the two meet.
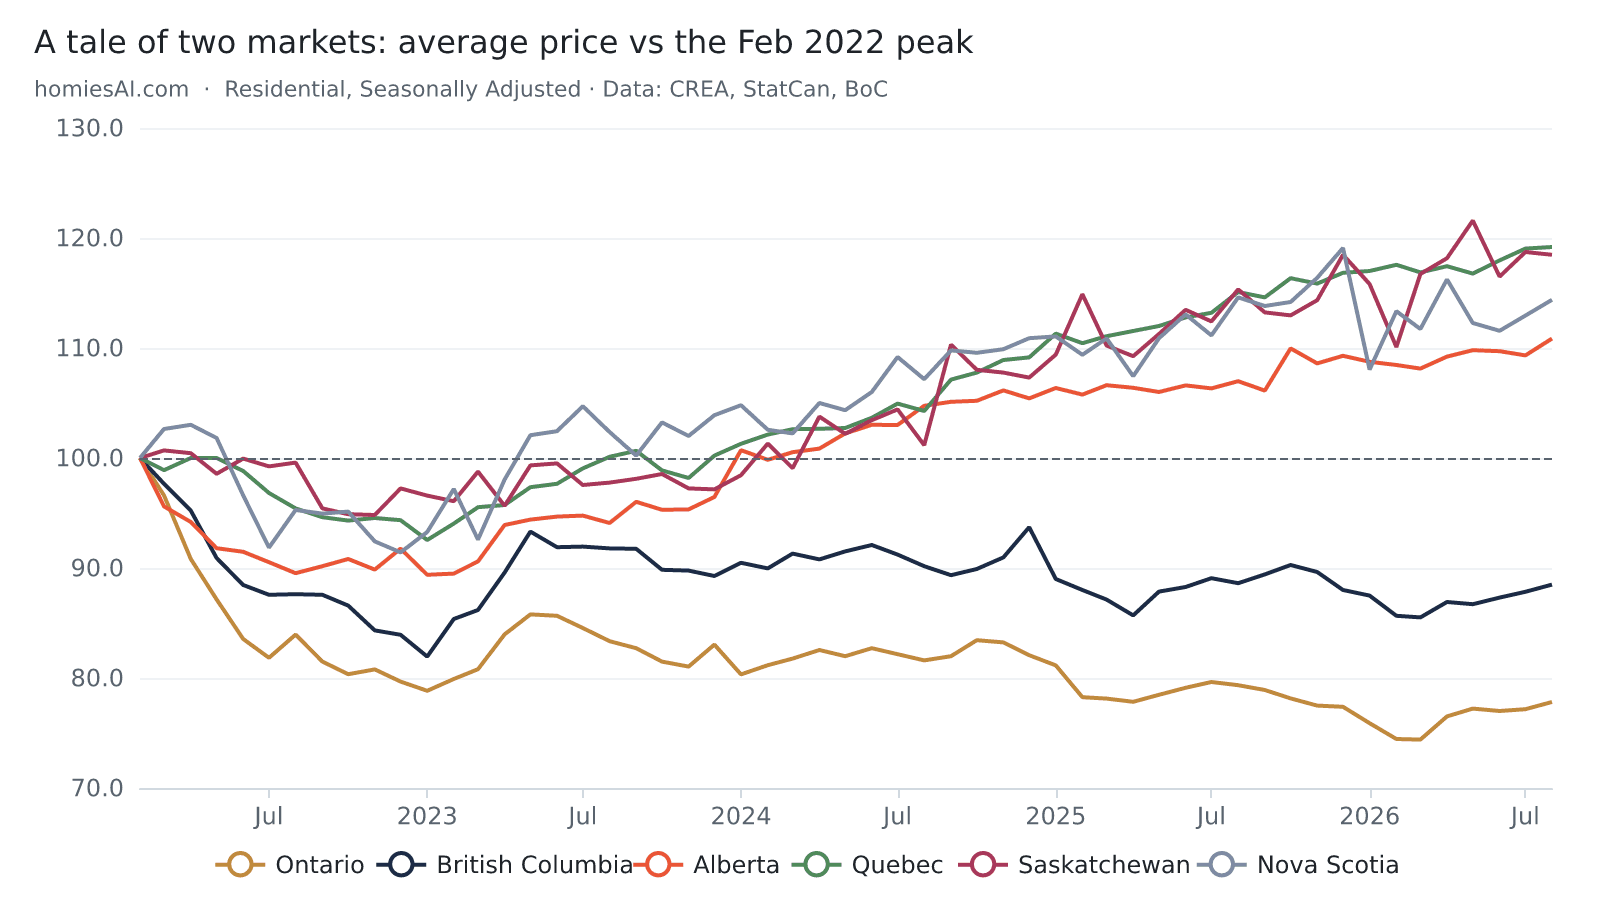
Ontario avg. price vs Feb 2022
−28%
$788,835 in August · BC −16%
Quebec avg. price
Record
$572,652 · +3.6% yr/yr · Alberta +3.8%
Toronto payment-to-income
68.3%
long-run average 54.5% (NBF)
Five-year GoC yield
3.57%
Sept 21 · overnight rate 2.25%
Housing starts (SAAR)
229,046
August · rental = 58% of starts YTD
Population, yr/yr
−0.45%
April 1, 2026 · third straight quarterly decline
Present from the page
Hit “Presenter mode” (bottom right). The prose disappears, each chart fills the screen, and the arrow keys step through the slides.
Copy into Google Slides
Custom charts have a “PNG for slides” button. Live charts open full screen with an Export PNG button. Third-party charts download as images.
Speaker notes
Every slide has a “Copy speaker notes” button: headline, talking points and the source, ready to paste into the notes panel.
The argument in one paragraph
Canada’s correction is an affordability correction, and it is happening only where affordability broke. The markets still searching for a floor are finding one the usual way: sellers step back, buyers step in. The next imbalance is already forming underneath, as rising yields choke the rental pipeline and population growth returns.

Daniel Foch
Podcast host · Habistat founder · Brokerage owner · Realtor
About me
I sell real estate, research it, and build the AI tools agents use to run their business.
Market research
Monthly market calls with Real Estate Magazine, and the live Canadian housing data behind every chart in this deck.
Podcast host
Talking Canadian real estate, rates and the economy with investors and agents.
Realtor and brokerage owner
The tools get built around real listings, real offers and real clients.
Homies
Building Homies at Valery: the AI team for real estate professionals.
Part I
Two Canadas
Same country, same central bank, same five-year bond. Ontario and British Columbia are 16–28% below their 2022 highs; the affordable provinces set records this year.
Canada does not have a housing market. It has at least two, and in 2026 they are moving in opposite directions. Ontario’s average price is 28 per cent below its February 2022 peak and British Columbia’s is 16 per cent below. Over the same stretch, Quebec, Alberta, Saskatchewan and most of Atlantic Canada set new records. Same central bank, same mortgage rules, same bond market.
That is why a national average is close to useless this year. Canada’s August average price, $668,219, was up 0.6 per cent from a year ago. That figure averages Toronto’s 2.7 per cent decline with Calgary’s 5.0 per cent gain and describes neither market.
Two Canadas: average price against the February 2022 peak
Part I · Two Canadas- Seasonally adjusted, since February 2022: Ontario −22%, BC −12% — while Quebec is +19%, Saskatchewan +19%, Nova Scotia +14% and Alberta +11%.
- In raw August dollars Ontario's average ($788,835) is 28% below its $1,097,559 peak. Quebec set a record ($572,652, +3.6% yr/yr).
- Same rates, same central bank. What differs is what a home costs relative to local incomes.
The affordable provinces are at — or just off — all-time highs
Part I · Two Canadas- On a 12-month average, Alberta, Quebec, Saskatchewan and Newfoundland and Labrador are all at record prices in August 2026.
- Monthly highs came this spring — Alberta $543,480 and Saskatchewan $391,496 in May, Nova Scotia $516,873 in April.
- “Coming off the highs” is not a correction: year-over-year prices are still up in AB, QC, SK and NL.
The same split, city by city
Part I · Two Canadas- Seasonally adjusted, since February 2022: Fraser Valley −25%, Hamilton-Burlington −23%, Toronto −22%, Greater Vancouver −8%.
- Calgary +18%, Edmonton +9%, Winnipeg +6%, Halifax +5%. Calgary's August average was $650,730, up 5.0% on the year.
- The line is not east versus west. It is expensive versus affordable.
All 105 markets, ranked from the 2022 peak to today
Part I · Two Canadas · Backup- 54 of 105 CREA markets have a lower average price than in February 2022.
- The ten biggest declines are all in Ontario: Southern Georgian Bay −39%, Durham −34%, Barrie −32%, Kitchener-Waterloo −30%.
- The top is small Prairie and Atlantic boards up 30–50%. (Ignore Thompson, MB: a tiny board.)
Part II
Affordability is the dividing line
The markets that fell are the ones where a mortgage payment ran furthest above incomes. The long-run channel says how far there still is to go — and the rent-versus-own gap says the same thing in condos.
The markets that corrected are the ones that had run furthest above local incomes. On National Bank’s measure, Toronto buyers needed 90.9 per cent of the median household income to carry the median home at the Q4 2023 peak. Today they need 68.3 per cent, still 13.8 points above the city’s long-run average. Toronto spent roughly two decades with the payment between about 40 and 50 per cent of income. That range is the channel prices can drift back toward, through some mix of flat prices, rising incomes and eventually lower rates.
The condo market shows the same thing from another angle. Owning a representative Toronto two-bedroom now costs about $404 a month more than renting one, a 13.9 per cent premium, down from roughly 55 per cent in 2022. Before 2018, owning was usually cheaper than renting. When the premium returns to its long-run level (about 7 per cent, read from NBF’s chart), buying stops being a bet on appreciation and becomes a housing decision again.
Price-to-income: where each market sits against its own history
Part II · Affordability is the dividing line- Toronto's average price is 9.7× median family income, against a 2000–2019 average of 6.5× (peak 11.7× in 2022). Vancouver: 11.3× vs 9.1×.
- Calgary (5.6×), Winnipeg (4.0×) and Halifax (5.5×) are cheap in dollars but at or near their own records — which is why they are cresting.
- Income is StatCan's 2023 T1 Family File, the latest available, so 2026 ratios run slightly high.
The long-run channel: mortgage payment as a share of income since 1980
Part II · Affordability is the dividing line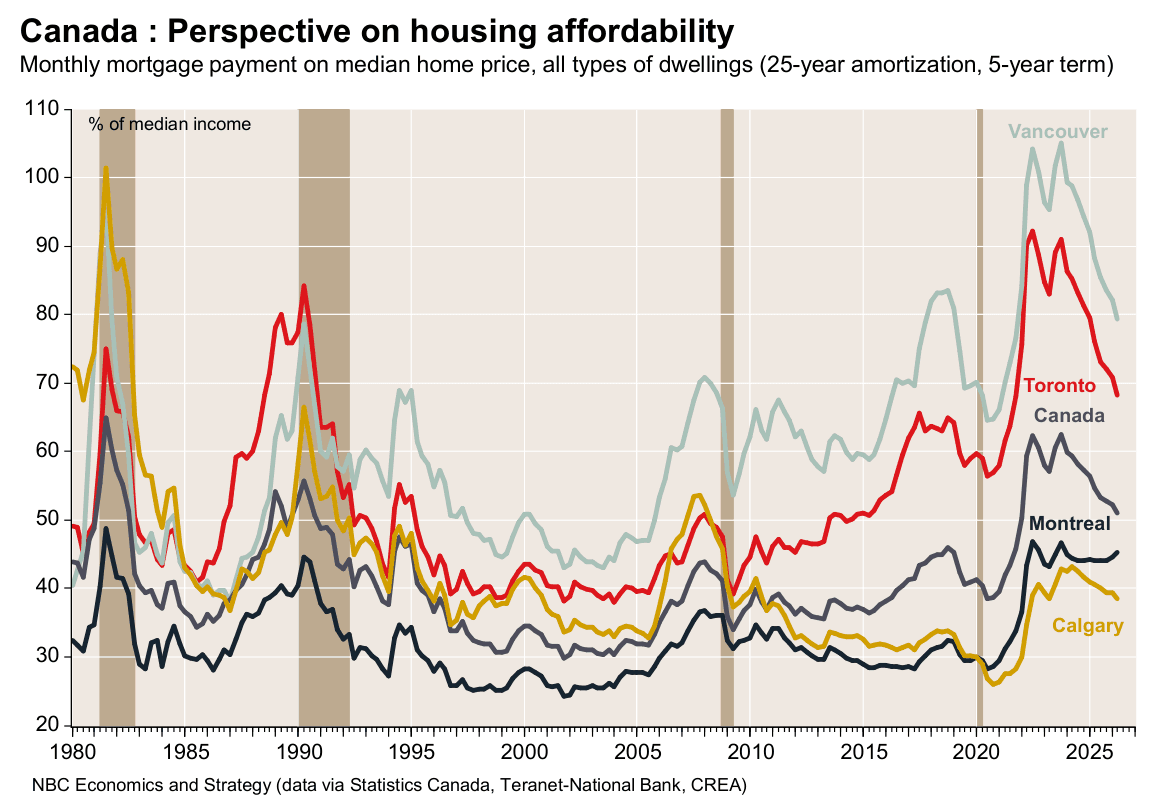
- From the mid-1990s to about 2015, Toronto's payment sat mostly between about 40% and 50% of income (read from the chart). It is 68.3% today.
- Canada's composite is 51.1% — the tenth straight improvement, and still 10.4 points above its average since 2000 (40.7%).
- Getting back into the channel takes some mix of lower prices, higher incomes and lower rates. NBF says rates will not help over the next year.
Toronto: better than 2023, still far above normal
Part II · Affordability is the dividing line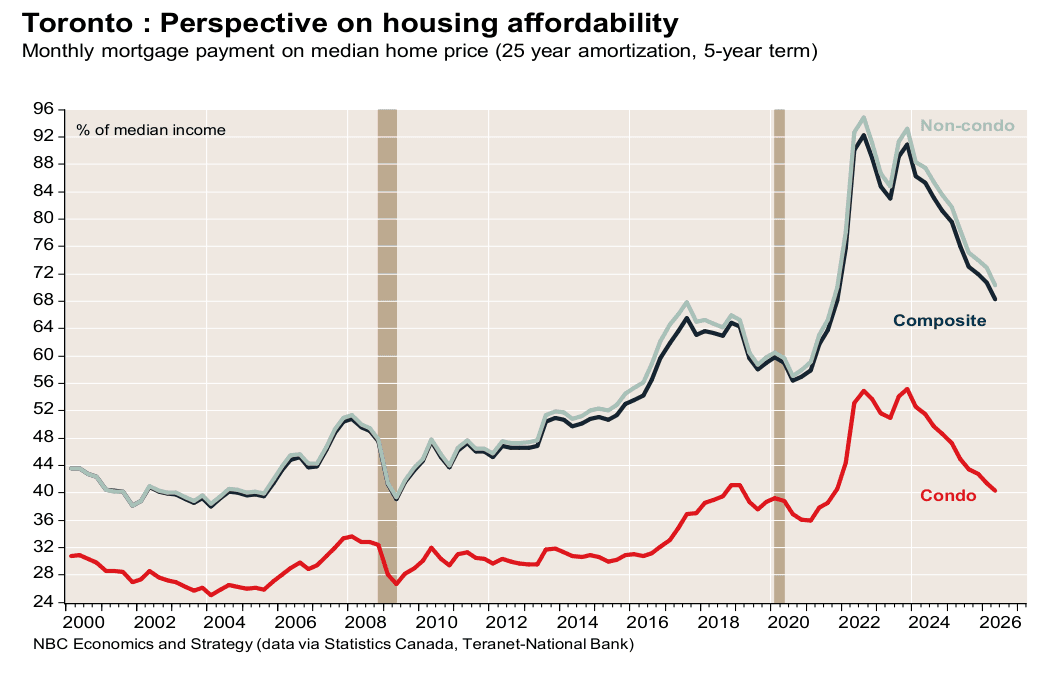
- 68.3% of median income in Q2 2026, down from 90.9% at the Q4 2023 peak — and still 13.8 points above Toronto's long-run average of 54.5%.
- Qualifying for the median home ($1,043,885) takes about $236,780 of income. Median income is $98,575.
- Condos are closest to normal: 40.2% against a 34.3% average.
Every major city is still less affordable than its norm
Part II · Affordability is the dividing line · Backup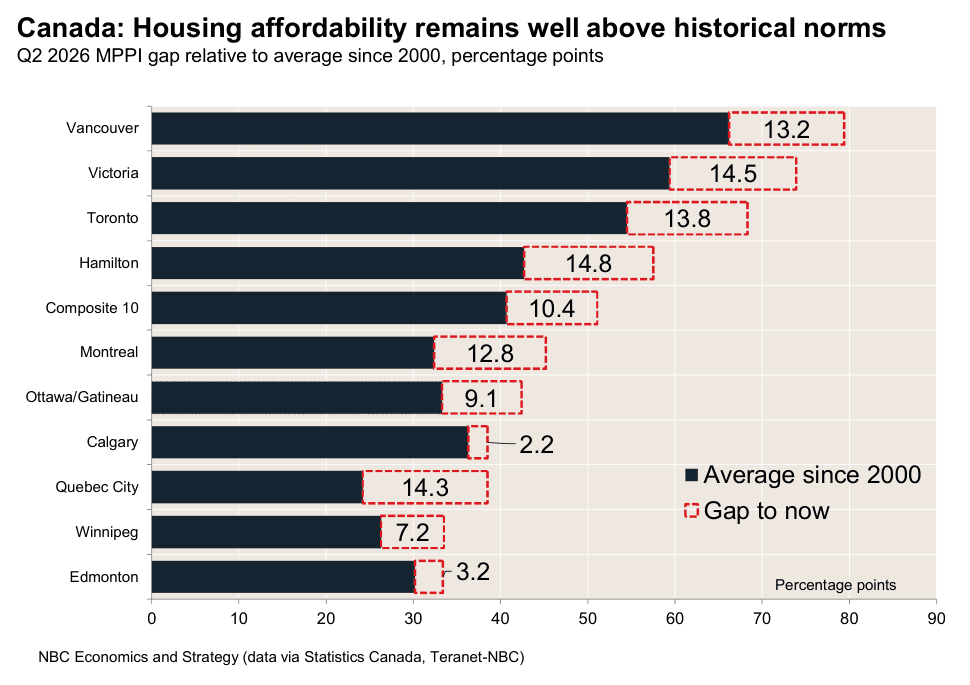
- Hamilton +14.8 points above its average, Victoria +14.5, Toronto +13.8, Vancouver +13.2.
- Edmonton (33.4%) and Calgary (38.5%) are the most affordable large cities in the index.
- The gap is widest in the Golden Horseshoe and the Lower Mainland — the same markets that corrected most.
Rent vs own: the Toronto condo premium is closing
Part II · Affordability is the dividing line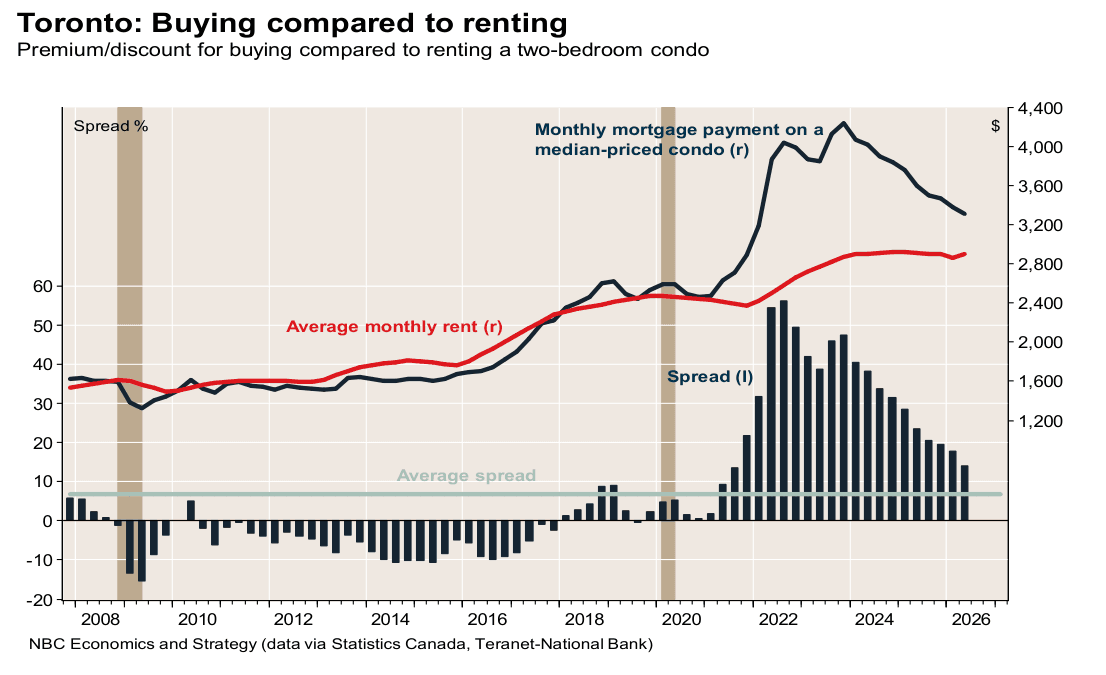
- Owning a representative 2-bedroom condo costs $3,306 a month; renting one costs $2,902 — a 13.9% premium, about $404 a month.
- The premium peaked near 55% in 2022. Before 2018, owning was usually cheaper than renting.
- It is closing because condo prices are falling ($615,384, −8.9% yr/yr) while rents are flat. The long-run average spread is roughly 7% (read from the chart).
Bank of Canada affordability index vs the five-year mortgage rate
Part II · Affordability is the dividing line · Backup- The Bank of Canada's index — the share of disposable income needed to carry a home — was 41.3% in Q2 2026, down from 54.5% in Q3 2023.
- Its 2000–2019 average was 33.1%, so the improvement so far has closed only about half the gap.
- The posted five-year rate is 6.09% and has not moved since June.
Part III
Volume, balance and inventory
Sales are down almost everywhere this year — including the Prairies, which are cooling from records. Market balance is converging toward the middle from both ends.
Volumes tell a less comfortable story for the affordable provinces. National sales from January to August were the lowest since 2003, and Alberta’s were down 10.2 per cent on the year, more than four times Ontario’s 2.4 per cent decline. The Prairies are still busier than in 2019, but they are cooling from records as listings rebuild. Market balance is converging from both ends: Ontario’s seasonally adjusted sales-to-new-listings ratio has risen toward balanced, while Quebec’s has fallen out of seller’s territory.
National home sales, one line per year
Part III · Volume, balance and inventory- August sales were 6.9% below August 2025.
- January–August sales are down 5.3% year over year and 36% below the 2021 pace.
- That is the fewest January–August sales since 2003 — in a country with 31% more people.
Sales against 2019: the Prairies are still busier, Ontario is not
Part III · Volume, balance and inventory- Seasonally adjusted and indexed to January 2019: Ontario 81, Canada 97, Quebec 98, BC 103.
- Alberta (139) and Saskatchewan (142) are still well above 2019 — but Alberta's year-to-date sales are down 10.2%.
- The affordable markets are cooling too. They are cooling from records.
Market balance: converging toward the middle from both ends
Part III · Volume, balance and inventory- CREA calls 45–65% sales-to-new-listings balanced. Ontario is 42.0% (buyer's), BC 45.3% (just balanced).
- Quebec fell from 66.5% to 55.7% in a year; Alberta from 62.3% to 58.4%. Saskatchewan (67.8%) is still a seller's market.
- Canada overall: 49.1% — squarely balanced.
Homes for sale against pre-pandemic: 146 in Ontario, 43 in Saskatchewan
Part III · Volume, balance and inventory- Ontario has 46% more active listings than in August 2019; Saskatchewan has fewer than half.
- But the direction has flipped: Ontario inventory is −3.9% yr/yr and BC −5.2%, while Quebec is +18.8%.
- Ontario's 2026 summer peak was lower than 2025's — the first lower high since the correction began.
Part IV
The market is looking for its price
Microeconomics 101, visible in the listings data: as prices fall, fewer owners are willing to sell and more buyers are willing to buy.
As the price falls, fewer owners are willing to sell at it and more buyers are willing to buy. That is visible in the listings data. Toronto new listings are down 14.1 per cent year over year, while Toronto’s January-to-August sales are flat on 2025 after three years of decline. Supply is contracting faster than demand, which is how a market finds a floor. It is not yet a recovery. Toronto is still a buyer’s market on CREA’s bands; it is simply a tighter one than a year ago.
As prices fall, sellers step back
Part IV · The market is looking for its price- Toronto new listings were down 14.1% year over year in August; Ontario −8.1%, British Columbia −9.3%.
- Fewer owners are willing to sell at today's prices. Supply adjusts before price does.
- TRREB's August release: lower inventory is “pointing to renewed price growth.”
…and buyers step in: Toronto sales stopped falling
Part IV · The market is looking for its price- Toronto's January–August sales are flat on 2025 (+0.1%) — after three years of decline. Still 54% below 2021.
- Seasonally adjusted, Toronto's sales-to-new-listings ratio rose from 35.0% to 40.7% in a year: still a buyer's market, a tighter one.
- Jason Mercer (TRREB) in the spring: lower prices and borrowing costs were “a catalyst for some homebuyers.”
Part V
New construction: price discovery
The enhanced HST rebate is doing what it was designed to do for ground-oriented homes — and the headline price indexes can't tell a rebate, a product-mix shift and a crash apart.
New construction is where policy is doing the most visible work. The enhanced HST rebate, which removes the sales tax on new homes below $1 million, took Ontario new-home sales up 130 per cent year over year in the second quarter. In the GTA, single-family new-home sales have run above their 10-year average for five straight months. Part of that is base effect, because 2025 was a record low. But builders are now selling low-rise homes at a normal pace for the first time in years.
The same policy is scrambling the price indexes. The GTA single-family benchmark fell 10.7 per cent in a single month in June, and one outlet called it a crash. It is a list-price index, gross of the rebate, with no adjustment for size. Builders are reshaping product to fit under the $1 million cap. Floorplan-level data shows what is really happening: cuts outnumber raises almost three to one. Most “flat” prices are cheaper once the rebate is counted. That is price discovery, and it is moving in buyers’ favour. Condos are the exception: the rebate’s timing rules keep most high-rise projects out, and condo sales remain 78 per cent below normal.
The HST rebate is working — on a record-low base
Part V · New construction: price discovery- Ontario new-home sales rose 130% year over year in Q2 2026 (8,410 vs 3,645). BILD and OHBA attribute 4,765 of them to the enhanced HST rebate, which began April 1.
- GTA, August: 692 single-family new-home sales, 47% above the 10-year average — the fifth straight month above it. August 2025 was a record low (182 as first reported), so part of the jump is base effect.
- Condos are not participating: 215 sales, up 50% on the year but still 78% below the 10-year average.
The “crash” headline: what the new-home benchmark measures
Part V · New construction: price discovery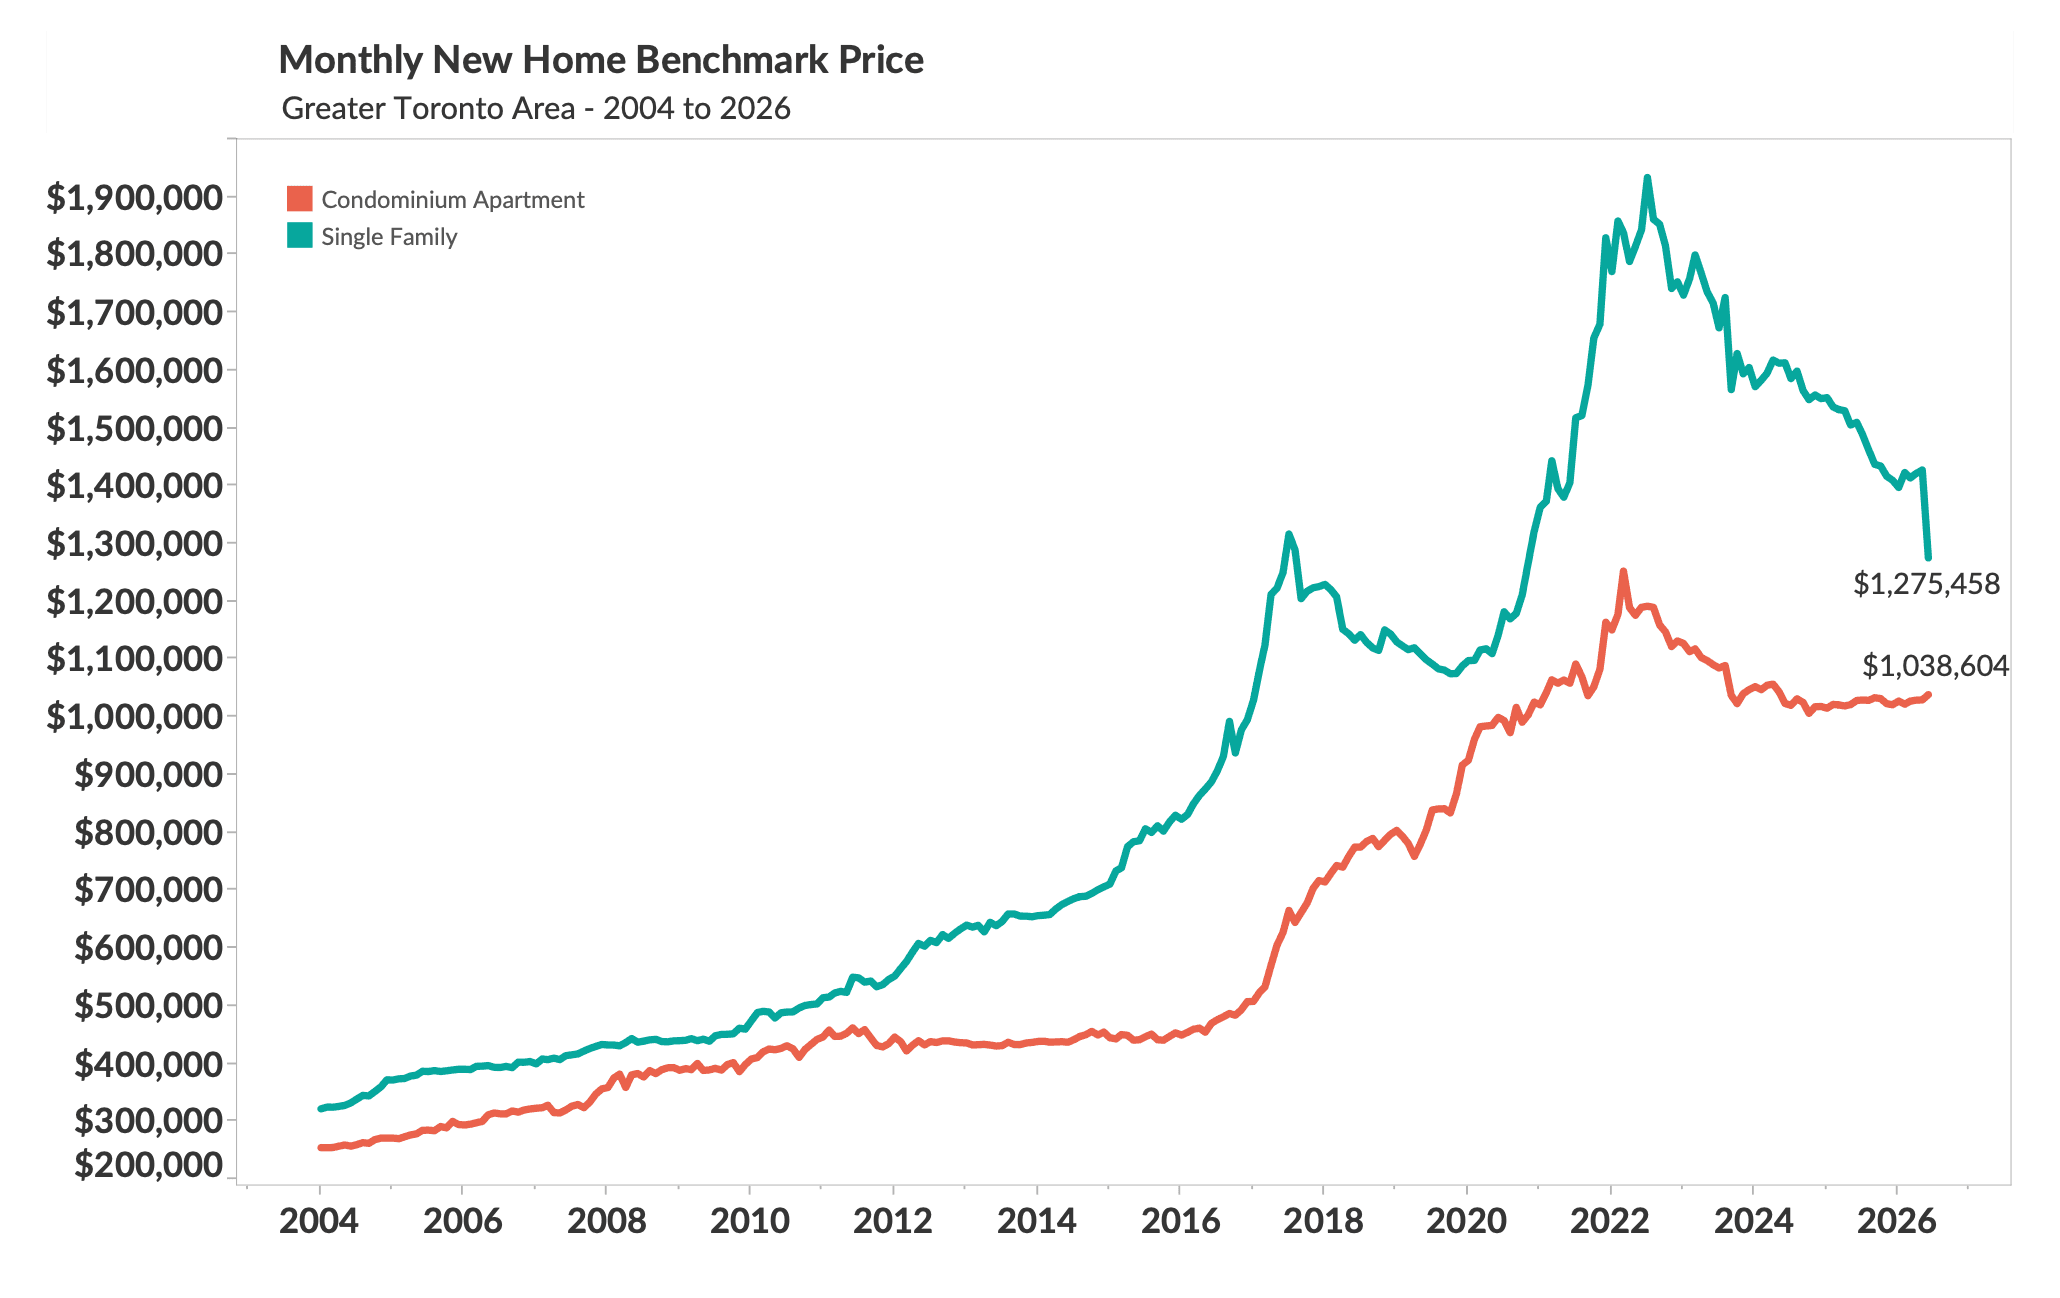
- Better Dwelling framed June's 10.7% one-month drop in the GTA single-family benchmark ($1,275,500) as the worst month on record. August: $1,248,866, −14.6% year over year.
- The benchmark is a list-price index, gross of the rebate, with no size or location adjustment. Builders are shifting to smaller product under the $1 million rebate cap — Altus: product “appealing to the more cost-conscious buyer.”
- Better Dwelling itself concedes the drop is more likely a measurement problem than reality. This is price discovery, not collapse.
Builders are cutting 2.86 times as often as they raise
Part V · New construction: price discovery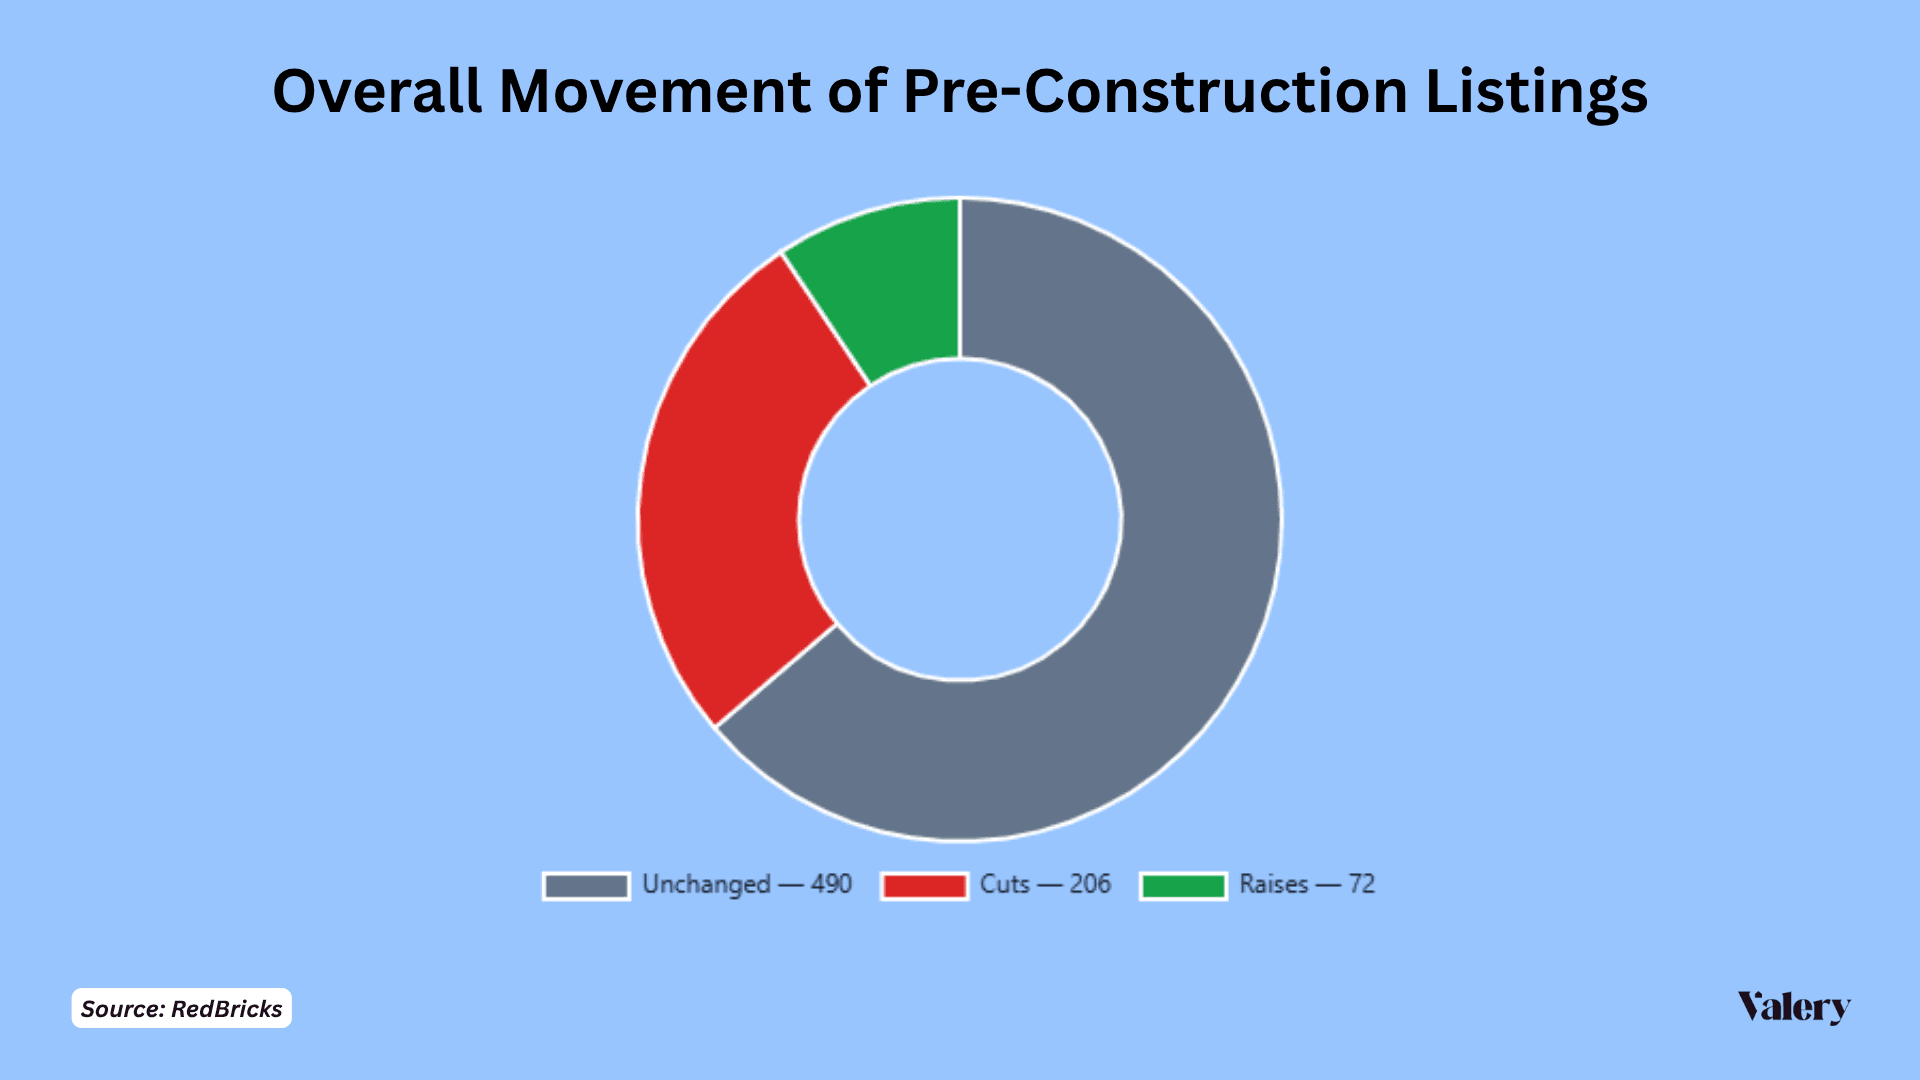
- Across 768 active GTHA pre-construction floorplans (Red Bricks): 26.8% cut, 63.8% unchanged, 9.4% raised.
- TRREB's newly built resale listings show the same ratio: 21.4% reduced, 3.1% raised.
- Cuts are concentrated in ground-oriented and $500K–$1.2M product — exactly where the rebate bites hardest.
Flat sticker prices, lower effective prices
Part V · New construction: price discovery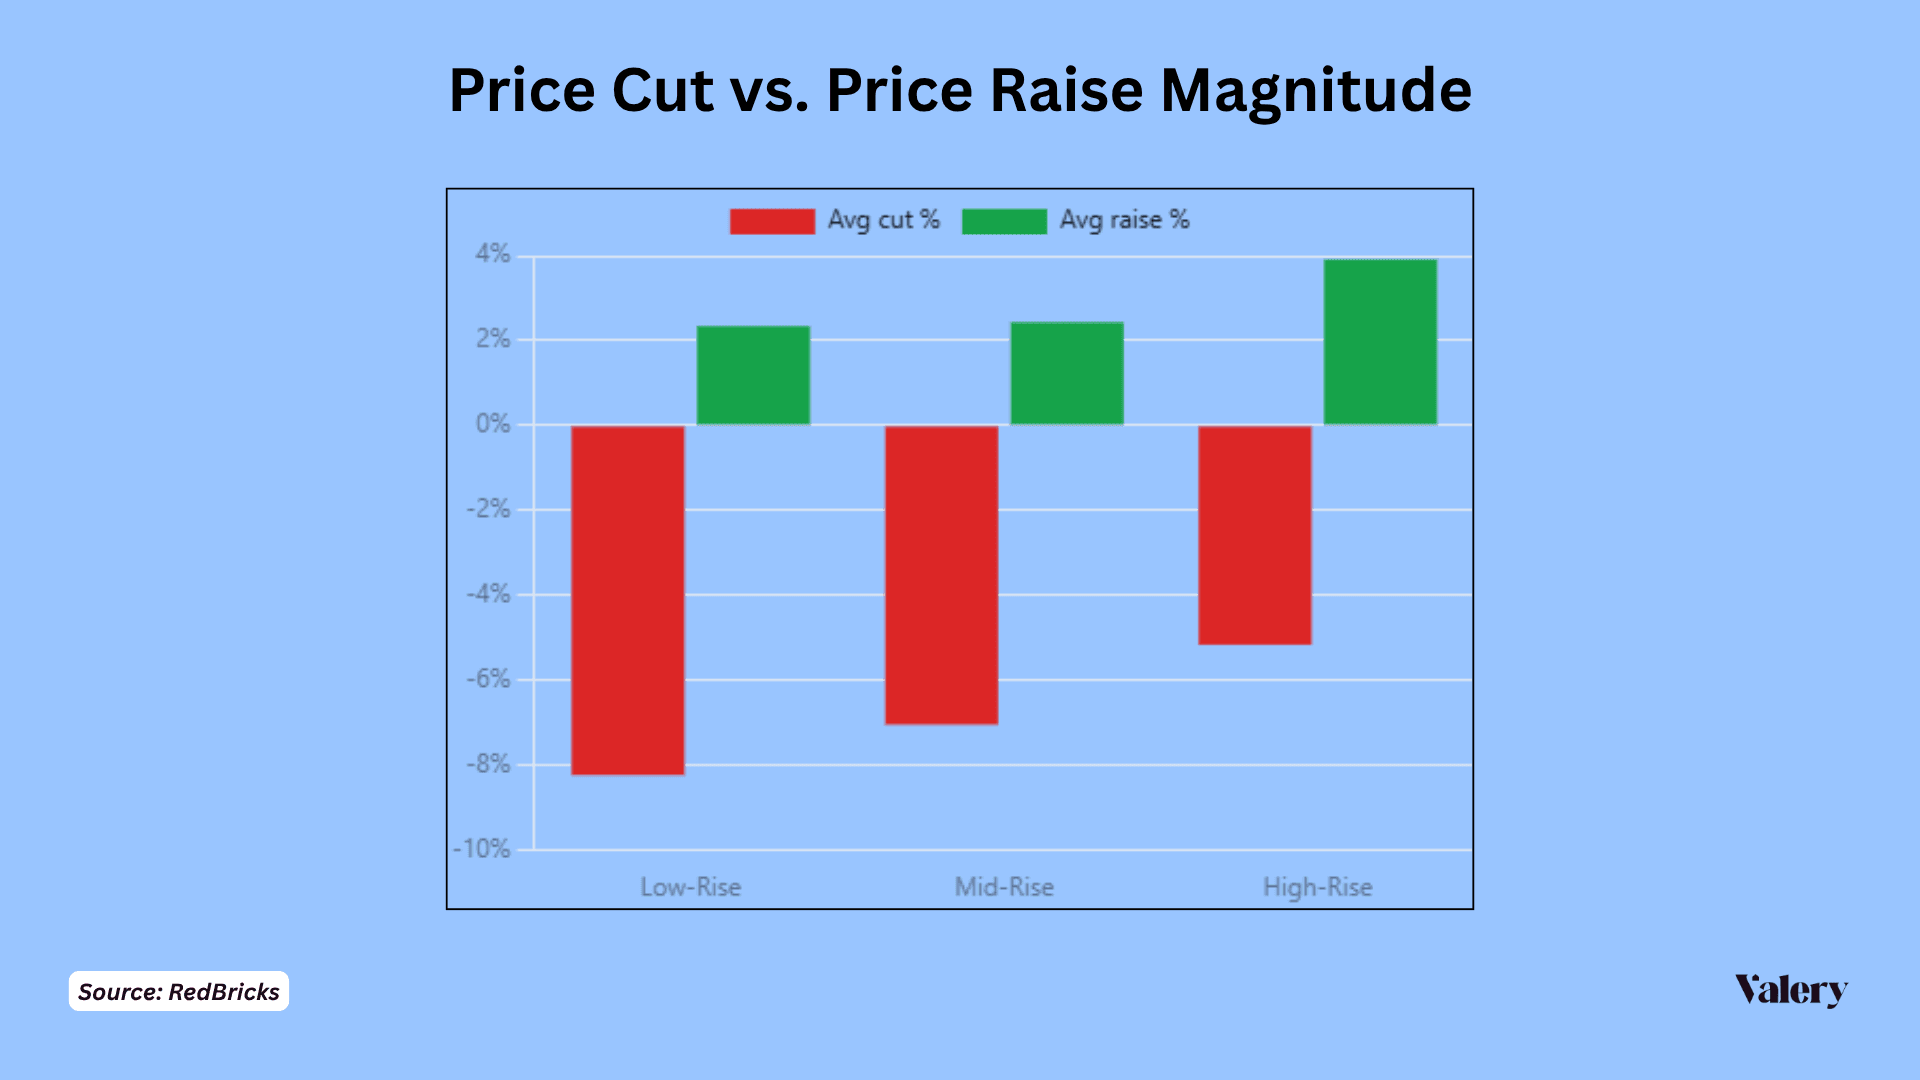
- Average cut −7.45% vs average raise +2.88%. Low-rise cuts are the deepest; high-rise is the most rigid.
- Only 3 of 72 observed price increases exceed the ~13% HST benefit — most buyers are still better off after the rebate even when the sticker went up.
- Counting explicit cuts plus rebate-eligible flat pricing, Valery estimates 90–95% of active inventory has improved effective affordability.
Ontario's new housing price index: the longest soft patch since the 1990s
Part V · New construction: price discovery · Backup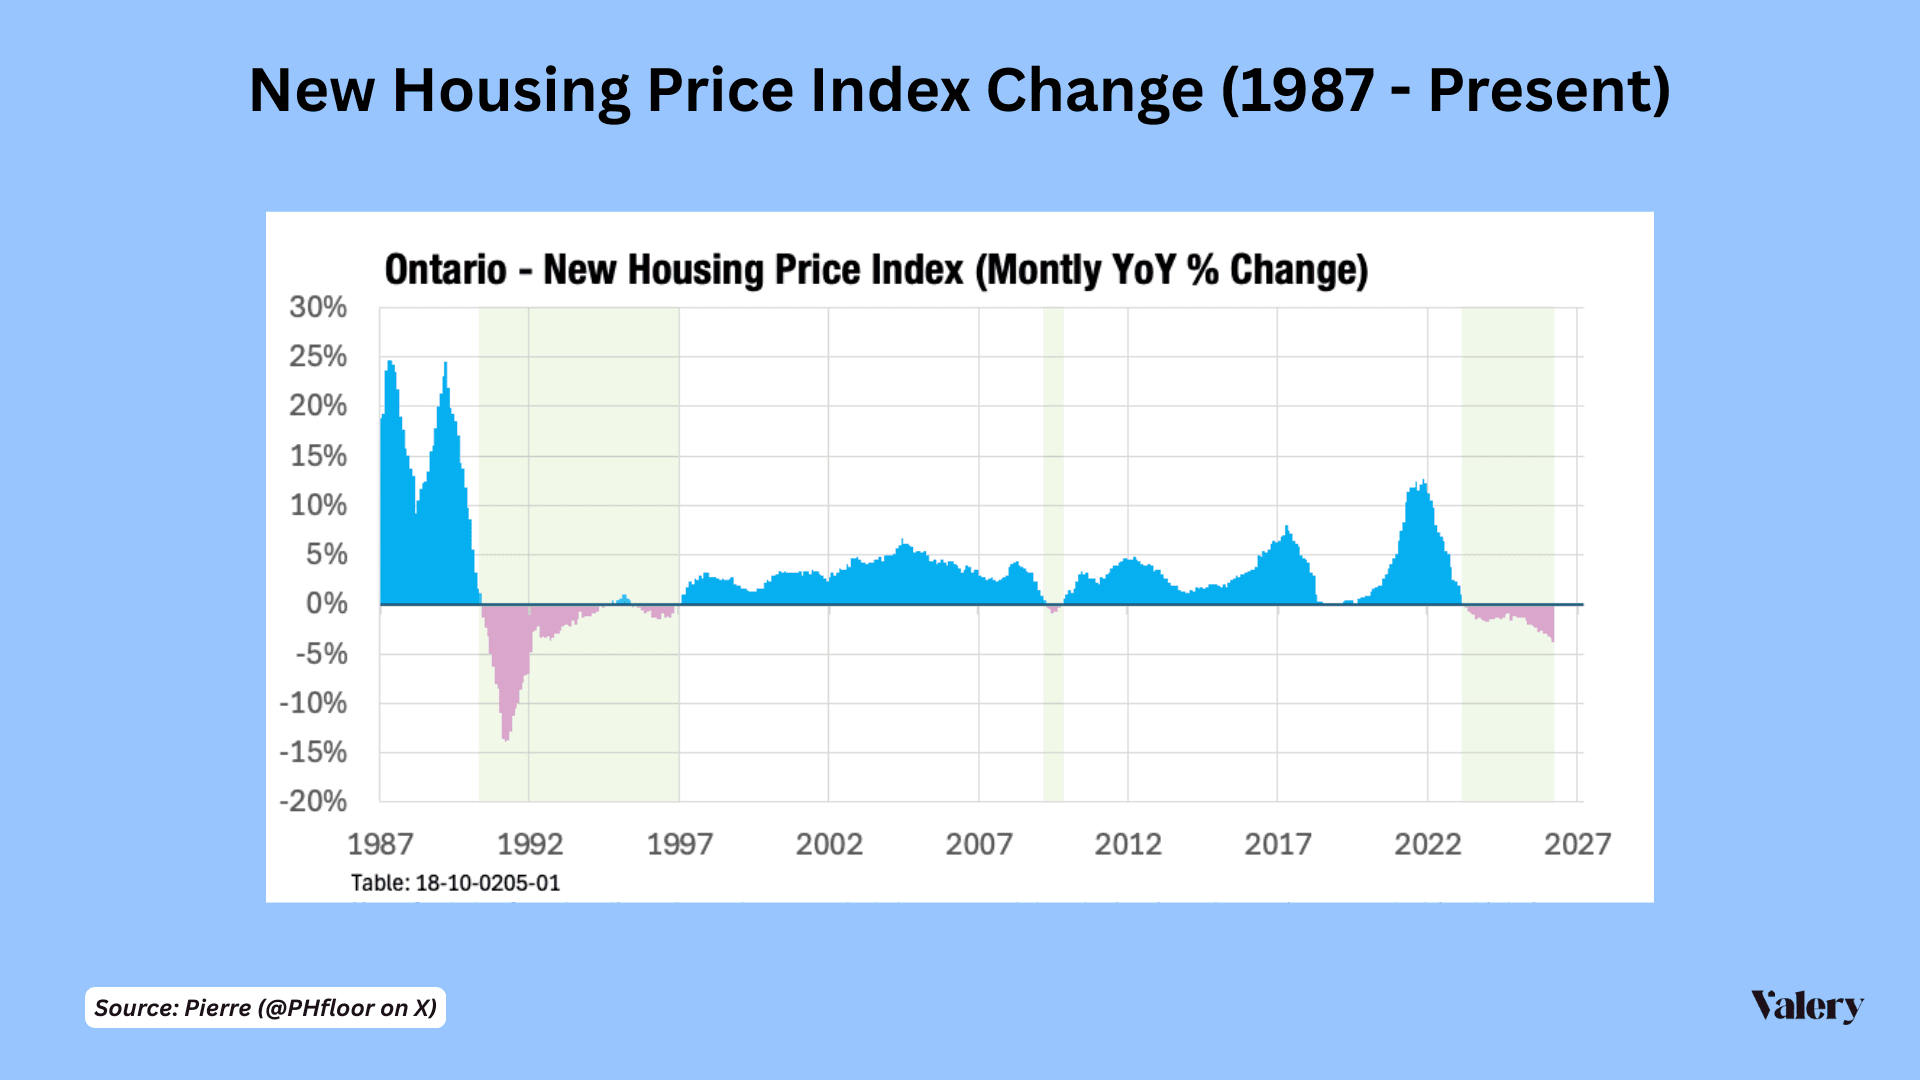
- StatCan's New Housing Price Index for Ontario is negative year over year — builders' own prices are falling.
- That is one of the longest runs of builder-price softness since the early 1990s.
- Ground-oriented product is adjusting first; high-rise pricing is stickier.
Part VI
Bond yields, oil and the supply pipeline
The Bank of Canada is on hold at 2.25%, but the bond market is tightening for it — and purpose-built rental, the only thing keeping starts up, is the most rate-sensitive product in housing.
The Bank of Canada has held the overnight rate at 2.25 per cent since late October 2025. The five-year Government of Canada yield, which prices five-year fixed mortgages and insured apartment loans, has risen from about 2.7 per cent to 3.57 per cent. Oil is above US$100 again and diesel refining margins are at a record monthly high. Those are inflation pressures, and inflation expectations are what longer bond yields price.
That matters most for the one segment still building. Purpose-built rental made up 58 per cent of starts by intended market this year, while condo starts fell to their lowest January-to-August total since 2009. Rental is financed with CMHC MLI Select at up to 95 per cent loan-to-cost over 50 years, priced off the Canada Mortgage Bond. At that leverage and amortization, a 90-basis-point move in the five-year yield is the difference between a project that pencils and one that does not.
The Bank is on hold. The bond market isn't.
Part VI · Bond yields, oil and the supply pipeline- The overnight rate has been 2.25% since late October 2025. The five-year Government of Canada yield closed at 3.57% on September 21 — up from a 2.67% monthly average in March 2025.
- The curve has steepened: 2-year 3.29%, 10-year 3.84%. Five-year fixed mortgages and CMHC-insured apartment loans price off this part of the curve.
- Rate cuts at the short end are not reaching borrowers.
Oil is back above $100
Part VI · Bond yields, oil and the supply pipeline- WTI was US$107.02 and Brent US$130.80 on September 15, 2026. A year ago WTI averaged about US$64.
- Energy feeds headline inflation directly — and inflation expectations are what long bond yields price.
- For Canada, oil is also income: it helps Alberta and the federal balance sheet while squeezing everyone else.
Diesel margins are at a record monthly high
Part VI · Bond yields, oil and the supply pipeline- The diesel crack spread — what refiners earn turning a barrel of crude into diesel — averaged US$107 in September so far, the highest monthly average since at least 2010. It averaged about US$23 before 2021.
- Diesel moves freight, construction equipment and farms. It passes into goods prices faster than crude does.
- Upward pressure on inflation is upward pressure on the five-year yield — and on every construction loan priced off it.
Housing starts: four straight monthly declines
Part VI · Bond yields, oil and the supply pipeline- 229,046 units (SAAR) in August — flat on July and the lowest since March 2025. The six-month trend is 244,149, down 1.3%.
- 2025 was the fifth-highest year on record (259,028 starts). Year-to-date 2026 actual starts are down 4%.
- CMHC: gains in Quebec and Alberta “only partially offset the decline in other provinces, most notably, Ontario.”
Rental is now carrying the whole pipeline
Part VI · Bond yields, oil and the supply pipeline- January–August 2026: 80,382 purpose-built rental starts — 58% of starts by intended market, up from 29% in 2019.
- Condo starts collapsed to 23,134 (−33% yr/yr), the lowest January–August since 2009. Toronto started 156 condo units in the first half.
- Rental is the most interest-rate-sensitive product in housing (next slide).
Why rising yields matter most for rental: MLI Select
Part VI · Bond yields, oil and the supply pipeline- CMHC MLI Select lets a 100-point project borrow up to 95% of cost over a 50-year amortization. At that leverage, a small change in rate is a large change in cash flow.
- Insured multifamily loans price at the Canada Mortgage Bond yield plus about 60 bps — roughly 4.3% on five-year money today (Colliers).
- The 2025 premium surcharge (0.25% per 5 years beyond 25) took the top-tier premium from 2.55% to 5.18%. Rental starts were flat year over year this summer after a spring surge.
Starts by province: Quebec is now building almost as much as Ontario
Part VI · Bond yields, oil and the supply pipeline · Backup- Average SAAR so far in 2026: Ontario 62,393 (74,481 in 2024), Quebec 59,376, Alberta 47,652, BC 41,457.
- Ontario has almost twice Quebec's population.
- TD expects Ontario to recover to 79,700 by 2028 and Alberta to fall to 35,200.
Part VII
People, homes and the next imbalance
Population is shrinking while starts are still running near 230,000. That flips: population growth resumes as the pipeline cools.
Right now population is falling while starts are still running near 230,000 a year: excess supply of new homes relative to new people, which is part of why rents and condo prices are soft. That flips. The official projection has population growth negative through 2026 and turning positive during 2027. The PBO expects about 0.8 per cent a year in the medium term. CMHC expects starts to fall to 211,900 by 2028.
The flow arithmetic moves back toward demand, though on its own it does not return to the 2023 extreme. What tips it further is the stock: years of pent-up household formation. National Bank estimates 3.5 people per household created in 2025, against a historical norm of about 2. That is young adults and roommates who will form households when they can.
Population is shrinking — for three quarters running
Part VII · People, homes and the next imbalance- Canada had 41,417,056 people on April 1, 2026: −0.45% year over year and the third straight quarterly decline.
- Non-permanent residents fell from 3.15 million (October 2024) to 2.56 million.
- StatCan publishes the July 1 estimate on September 23, with larger-than-usual revisions to non-permanent residents.
The official path: negative through 2026, growth resumes in 2027
Part VII · People, homes and the next imbalance- Budget 2025 (StatCan M1) projects year-over-year growth of −0.2% to −0.3% through 2026, 0.0% in early 2027, and +0.4% by late 2027.
- Actual growth is running below that path: −0.45% at April 2026 against a projected −0.3%.
- The PBO has 2026 flat, +0.3% in 2027 and about 0.8% a year in the medium term.
New people per new home: from five to below zero, and back
Part VII · People, homes and the next imbalance- 2023–24: about 5 new residents for every home started — the excess-demand years. 2016–19 averaged 2.3.
- 2026: population falls while about 241,000 homes start — the most excess supply in the series. That is today's balanced-to-soft market.
- By 2028 (CMHC starts 211,900; PBO growth 0.8%) the ratio swings back toward 1.6. Direction: toward demand. Flows alone don't reach 2023 tightness — the backlog does the rest.
Part VIII
Credit: the headwind that lags
Unemployment has improved; mortgage arrears have not caught up. The Bank of Canada's own research says the warning signs show up on credit cards and lines of credit first.
The labour market has improved: unemployment is 6.4 per cent, down from 7.1 per cent a year ago. Mortgage arrears have not turned. They reached 0.29 per cent in May, the highest since 2016, and 0.28 per cent in June. That fits the Bank of Canada’s February research: households lean on credit cards and lines of credit about two years before they miss a mortgage payment. Those early signals are still flashing, especially for Ontario homeowners.
The honest read is “concentrated, not over.” The Bank’s Financial Stability Report says overall delinquency has stabilized. Equifax says the growth rate slowed in Q2. But the pocket that matters for housing, 2022–23 borrowers in the GTA, is still deteriorating.
Mortgage arrears move with unemployment — with a lag
Part VIII · Credit: the headwind that lags- Unemployment is 6.4% (August), down from 7.1% a year earlier. Mortgage arrears have not turned: 0.28% in June — May's 0.29% was the highest since 2016.
- Since 1995 the two series have moved together (correlation 0.89 on this chart). Arrears follow the job market; they do not lead it.
- Ontario arrears are 0.33%. Stress is concentrated in 2022–23 Toronto borrowers.
The Bank of Canada's path to mortgage delinquency
Part VIII · Credit: the headwind that lags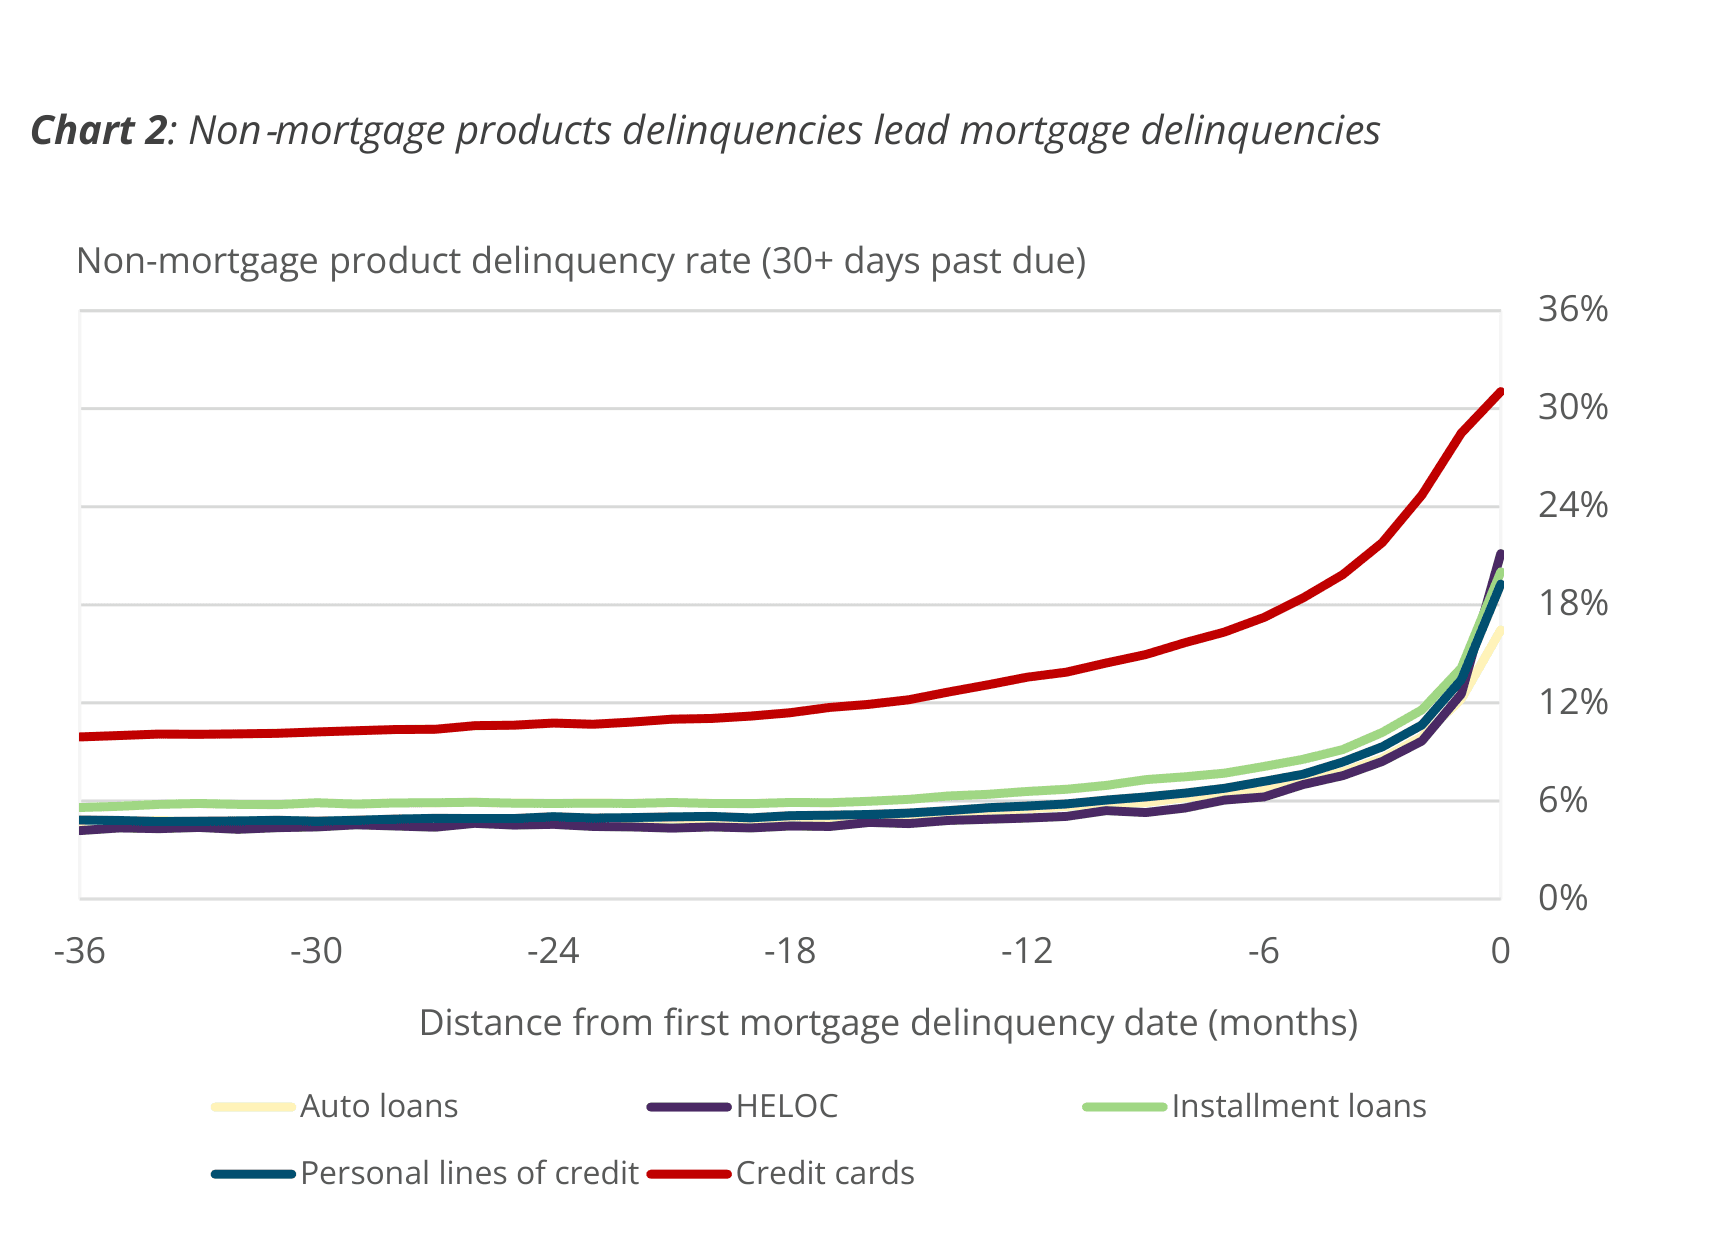
- About two years before a missed mortgage payment, households lean harder on credit cards and lines of credit.
- One to two years out, non-mortgage delinquencies start rising — credit cards first. In the last six months they accelerate sharply.
- Card delinquency among future defaulters rises by as much as 20 points. Watch unsecured credit to see mortgage stress coming.
Non-mortgage stress is still building
Part VIII · Credit: the headwind that lags- Instalment-loan arrears reached 2.58% in Q1 2026, a series high (1.64% in Q1 2023). Auto loans 0.80% vs 0.72% a year earlier.
- The share of indebted households 60+ days behind on anything hit 2.17%, also a series high.
- Equifax Q2: non-mortgage delinquency among mortgage holders is up 12.5% year over year — 27% in Ontario. That is the Bank's two-year warning light.
Consumer insolvencies: proposals dominate, bankruptcies move fastest
Part VIII · Credit: the headwind that lags · Backup- 37,147 consumer insolvencies in May–July 2026, 3.9% more than a year earlier.
- Most are proposals — households restructuring, not walking away.
- The Bank of Canada says delinquency has “stabilized” overall; the stress is concentrated, not over.
Part IX
Where the growth goes next
Trade exposure is concentrated in Ontario's manufacturing corridor; the growth forecasts point west.
The trade war falls hardest on Ontario’s manufacturing corridor: eight of the fourteen most tariff-exposed cities in the Business Data Lab index are in Ontario. Meanwhile TD, RBC and Scotiabank all have Alberta, Saskatchewan and Newfoundland and Labrador growing faster than Ontario and British Columbia this year and next, on energy and resource projects. Growth, and the jobs and migration that follow it, is drifting toward the markets that are still affordable.
Unemployment by province
Part IX · Where the growth goes next · Backup- July 2026: Ontario 6.8%, Alberta 7.0%, BC 6.2%, Quebec 5.6%, Manitoba 5.0%. August: Ontario 6.9%, Alberta 6.8%.
- Unemployment is not what separates the two Canadas. Price-to-income is.
- Canada's rate is 6.4% — above the 2022 low of 4.8%.
GDP is growing — residential construction isn't
Part IX · Where the growth goes next · Backup- Real GDP grew 2.0% year over year in June 2026.
- Residential building GDP was down 1.7% over the same period.
- The Spring Economic Update forecasts real GDP growth of 1.1% in 2026 and 1.9% in 2027.
Tariff exposure is an Ontario manufacturing story
Part IX · Where the growth goes next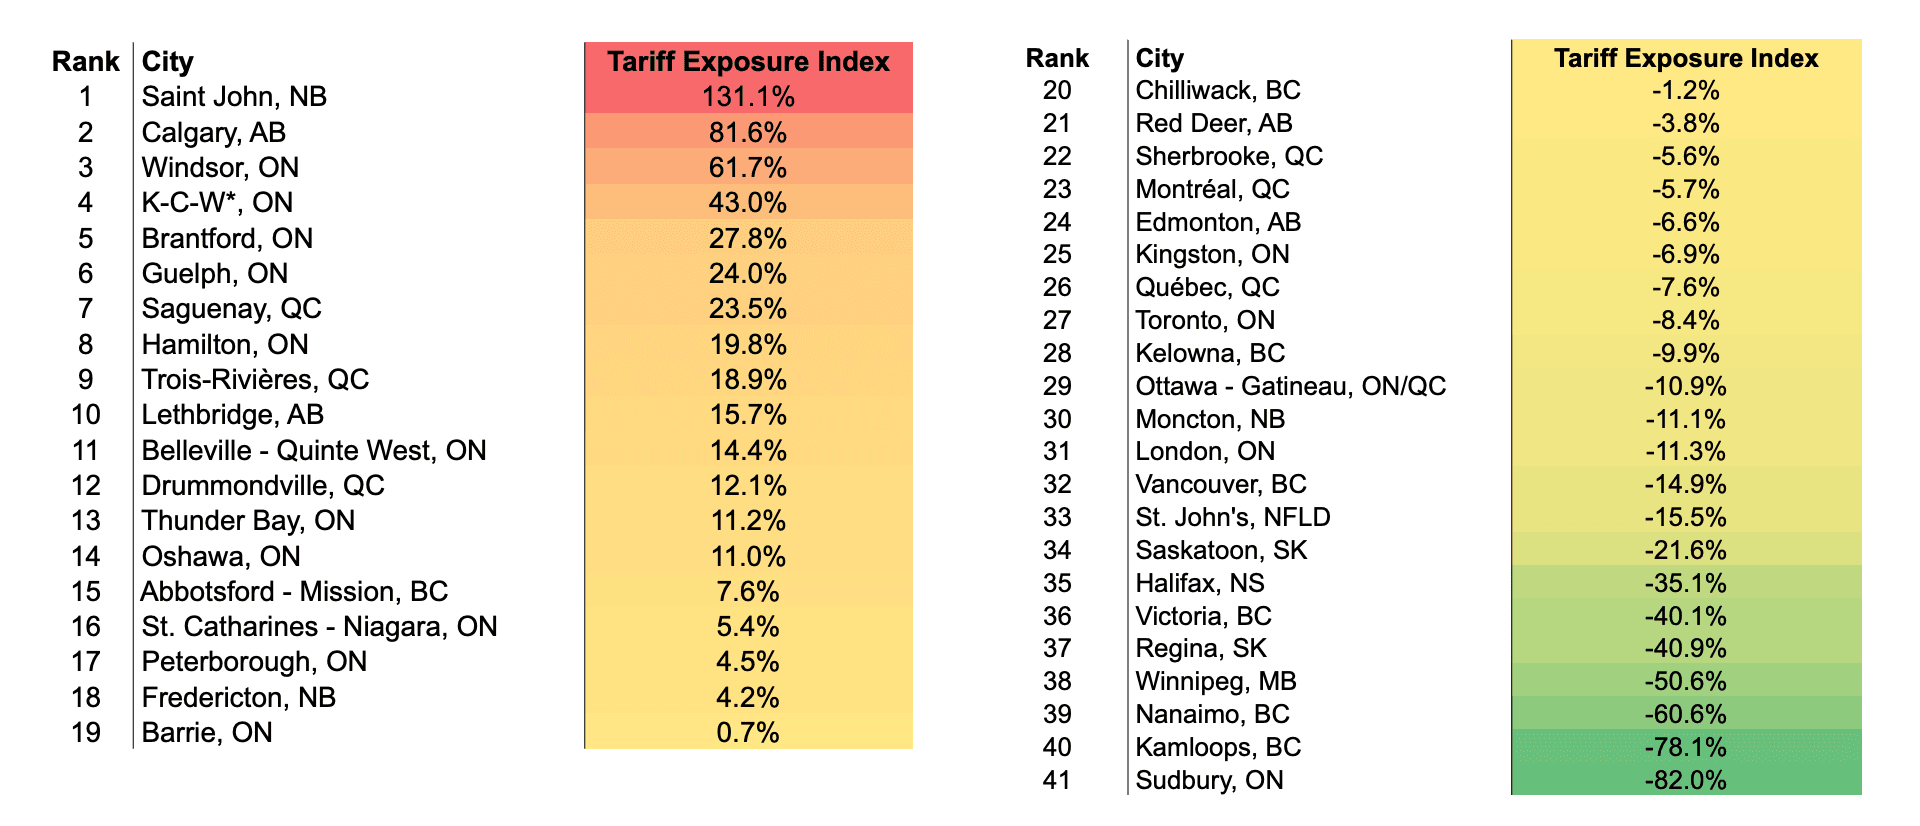
- Eight of the fourteen most tariff-exposed cities are in Ontario: Windsor, Kitchener-Cambridge-Waterloo, Brantford, Guelph, Hamilton, Belleville, Thunder Bay and Oshawa.
- Saint John and Calgary top the list on energy exports — but energy exemptions and a weaker dollar can cushion that shock.
- Winnipeg, Regina, Halifax and Saskatoon are among the least exposed.
Oxford Economics: the metros most tied to U.S. demand
Part IX · Where the growth goes next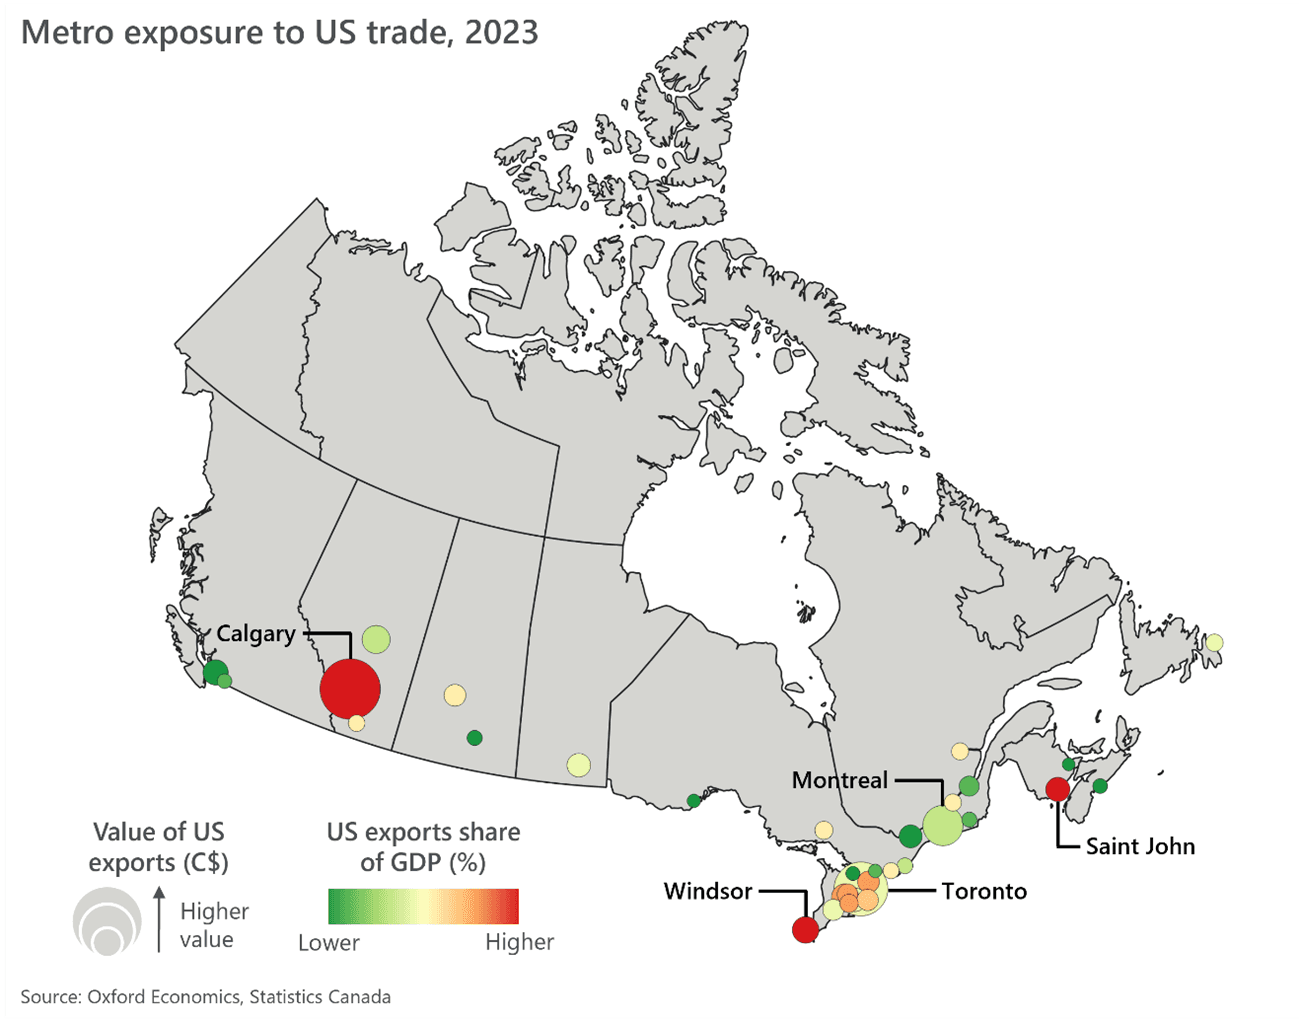
- U.S.-bound exports exceeded 60% of GDP in Calgary, Saint John and Windsor in 2023.
- Toronto exported $89 billion to the U.S. — the dense cluster of exposed metros around it is the Golden Horseshoe.
- Vancouver's U.S.-bound exports were only 5% of local GDP.
Growth forecasts point west
Part IX · Where the growth goes next- TD (September 21): Alberta grows 2.3% in 2026 and 2.4% in 2027; Ontario 0.6% and 1.5%; BC 0.8% and 1.7%. RBC and Scotiabank have the same ranking.
- The drivers are energy and resources — the West Coast Oil Pipeline proposal, mining projects, Build Canada Homes sites in Edmonton and Winnipeg.
- Defence spending ($81.8B over five years) is expected to help Nova Scotia most. Growth, and eventually demand, drifts toward the affordable markets.
Homies · AI tools for real estate
The AI team that runs your real estate business.
Homies is how we build AI for the real estate industry: agents that prepare the CMAs, offers, listing pages, content, follow-ups and market reports — connected to the CRM, calendar and data you already use, with your approval before anything goes out.
640 CMAs, 226 offers
Prepared by Homies members through early September 2026.
3,483 pages and reports
Listing pages, market reports and presentations, shared with one link.
23 connected apps
GoHighLevel, Lofty, Follow Up Boss, Gmail, Outlook, Canva, Meta Ads and more.
This deck
Every live chart here comes from the same data feed any Homie can turn into a branded report.
What would change the call
Five things to watch into 2027
- 1
The five-year yield
A move back below 3% reopens rental pro formas; a move toward 4% closes more of them. It is the single number that most changes the 2027–28 supply outlook.
- 2
Ontario new listings
If sellers keep stepping back while sales hold, the GTA's buyer's market tightens into balance. A new listing surge would say the floor is not in yet.
- 3
Non-mortgage delinquency among mortgage holders
The Bank of Canada's research says it leads mortgage arrears by one to two years. Equifax's Q3 read lands in November.
- 4
The July 1 population estimate (September 23)
StatCan warned of larger-than-usual revisions to non-permanent residents. A revision toward growth brings the demand turn forward.
- 5
Prairie inventory
Alberta and Quebec listings are rebuilding. If sales keep falling there, “coming off the highs” becomes a correction.
Every live chart on this page
Embed them in your own report
The CREA, StatCan, CMHC and Bank of Canada charts above are live views of homiesai.com/stats. They update when new data lands, and anyone can embed them. Open any chart, change the markets or the date range, and copy the embed code or export a PNG. Or ask Homies to build a version of this report for your own market.
Method, sources and caveats
Housing figures are CREA’s full August 2026 data package (loaded September 18). Price comparisons use the residential average price, which moves with the mix of homes sold. The charts use seasonally adjusted series where marked. Macro series come from Statistics Canada, CMHC and the Bank of Canada through the same public feed, refreshed September 22. Price-to-income divides the average price by StatCan’s median census-family income (T1 Family File, latest year 2023), so current ratios run slightly high.
Third-party charts are reproduced with attribution and link to the original: National Bank’s Housing Affordability Monitor, Q2 2026, the Bank of Canada’s Staff Analytical Paper 2026-3, the Canadian Chamber of Commerce’s Business Data Lab and Oxford Economics. The two tariff-exposure studies date from February 2025 and use different methods; they measure vulnerability, not realized losses.
Custom charts. Oil and diesel use EIA daily spot prices (the diesel crack is NY Harbor ULSD × 42 − WTI). Bond yields are Bank of Canada benchmark yields. Arrears by product are the Bank’s Financial Vulnerability Indicators, whose mortgage series (0.22%) is defined differently from the CBA’s 90-day arrears rate (0.28%). New residents per housing start divides July-to-July population growth by that year’s average SAAR of starts. The forecast years use the Budget 2025 / StatCan M1 population projection, the PBO’s 0.8% medium-term growth for 2028, and CMHC’s Housing Market Outlook baseline for starts. Provincial GDP forecasts are TD Economics, September 21, 2026.
Read with care. Values described as “read from the chart” (Toronto’s historical payment band, the condo average-spread line) are visual estimates; NBF does not publish them as numbers. Average household size has stopped falling since 2021 but is not clearly rising on StatCan’s household estimates. The “3.5 people per household created” figure is National Bank’s marginal measure. Correlations are descriptive, not causal.