Two markets, one country.
CREA's full September tables landed this morning. Here they are as an interactive report — thirteen live charts, every one zoomable and sourced — built as the comparison the data demands: Toronto and Hamilton-Burlington against Calgary, Edmonton, Halifax and Winnipeg. Plus the prompt that rebuilds it for any two markets against any four benchmarks.
Live data
The full September package ingested the day it dropped — 105 markets, 75 boards of property-type detail, back to 1980 nationally.
Thirteen charts
Six cities on one index, leverage, inventory, seasonality and every market ranked. Nothing here is a screenshot.
Yours
The prompt rebuilds this for your markets and benchmarks, in your brand colours, for the audience you pick.
Prompt library
Build this for your market
Every chart on this page is a live view of the same feed any Homie can read. Copy the prompt, paste it into Homies (or any AI with web access), and answer five questions — the one or two markets the report is about, the four cities to benchmark against, your audience, the narrative stance to hold, and your brand colours. It writes a report like this one for your markets, with these same interactive charts pointed at them and this month’s real numbers.
It is deliberately a comparison prompt rather than a single-market one. In 2026 the national average is the midpoint of two markets moving in opposite directions, so a one-market report hides the only thing a client actually wants to know: is my market the one that recovered, or the one still repairing? New to this? Start with the guide to AI market reports for realtors .
- 1
Copy the prompt
It is complete — nothing to fill in before you paste it.
- 2
Paste it into Homies
Or any AI with web access. It asks five questions, then waits.
- 3
Answer five questions
Your markets, four benchmarks, audience, narrative stance, brand colours. “Use the defaults” is a valid answer.
- 4
Review, then publish
It writes the report with these same live charts pointed at your markets, in your colours, and stops for approval before anything is sent.
Two-market comparison report
v1 — October 16, 2026
TWO-MARKET COMPARISON REPORT FROM LIVE DATA (powered by homiesAI.com). You will
build me (a realtor) a personalized, SEO-optimized housing market report that sets
my market against four benchmark cities, with LIVE EMBEDDED charts, using real
numbers from the Homies Stats feed. Never invent a number — every figure must come
from the feed.

URL BASE — read this first. Everywhere below, {BASE} means:
  https + :// + homiesai.com + /stats   (join the four parts, no spaces)
Spelled out in case a chat app stripped it: homiesai dot com slash stats, over
https. Example: {BASE}/data/manifest.json means the manifest URL on that base.
If anything below looks like a link went missing, rebuild it from {BASE}. Use no
other host.

WHY A COMPARISON AND NOT A SINGLE MARKET. As of September 2026 the Canadian
national average is the midpoint of two markets moving in opposite directions:
Southern Ontario and BC sit well below their January 2022 level while the
Prairies, Quebec and Atlantic Canada sit well above it. A one-market report
hides that. Always place my market against benchmarks.

STEP 1 — ASK ME FIVE QUESTIONS, THEN WAIT. Ask them as one short numbered list,
offer the defaults, and accept "just use the defaults" as a complete answer.

1. HOME MARKETS — which one or two markets is this report about? (Two works
   well when they are a pair my audience already compares: Toronto and
   Hamilton-Burlington, Calgary and Edmonton, Victoria and Greater Vancouver.)
   Default: Toronto plus Hamilton-Burlington.
2. BENCHMARKS — which four cities to measure against? Default: Calgary,
   Edmonton, Halifax-Dartmouth, Winnipeg. Suggest benchmarks that make my
   market look honest, not flattering: at least two from a different region.
3. AUDIENCE — buyers, sellers, investors, move-up families, downsizers, or a
   general database. Default: general. This changes the conclusion of every
   section, not just the closing paragraph.
4. NARRATIVE STANCE — pick one and hold it the whole way through:
   · "Straight read" — what the data says, no angle. (Default.)
   · "Opportunity" — where the mispricing is, for a buyer or investor.
   · "Caution" — what could still go wrong, for someone deciding to wait.
   · "Contrarian" — the consensus take and why the data complicates it.
   Never switch stance mid-report, and never let a stance override a number.
5. BRAND COLOURS — one of:
   · A preset: pal=royal-lepage | remax | century21 | exp | kw | homelife |
     ocean | sunset | mono | office
   · Custom hex: colors=E4002B,1A1A1A,F2A900 (no "#", comma separated, first
     colour is my market's line)
   · Default: the Homies colourway.
   Also ask for my name/brokerage for credit= on every chart. Apply the same
   choice to EVERY chart so the report reads as one piece.

STEP 2 — GET THE DATA. Points are [yyyymm, value] arrays. Try in this order:
1. Your web/URL-fetch tool (NOT code execution — many AI sandboxes block outside
   domains from code; the fetch tool usually works when code can't).
2. A code GET only if your sandbox has open internet access.
3. If neither works, build the {BASE}/api/chart image URLs in STEP 4 anyway —
   the server renders the data into the image, so the charts still work — and
   ask me to paste the headline numbers.
Endpoints (all on {BASE}):
- {BASE}/data/manifest.json — every geography with slug, name, level and latest
  month. RESOLVE EVERY SLUG HERE FIRST. Slugs are not guessable: Vancouver is
  greater-vancouver, national is canada-computed, Burlington is inside
  hamilton-burlington, Montreal is not a board (use the quebec province series).
  If the manifest carries "preliminary": true, the newest month came from CREA's
  press package and only the markets in preliminaryGeographies have it — say
  which month each figure is from rather than implying every market is current.
- {BASE}/data/{slug}.json — series keyed res.act.ap (average price), res.act.us
  (sales), res.act.nl (new listings), res.act.al (active listings),
  res.act.snlr (sales-to-new-listings), res.act.moi (months of inventory).
  "res.act" is residential, actual — NOT seasonally adjusted.
- {BASE}/data/measure/res.act.ap.json — one measure across all 105 markets, for
  rankings.
- {BASE}/data/unit/{slug}.json — property-type detail: det/semi/twn/apt crossed
  with msp (median price), ns (sales), adom (average days on market). 75 boards;
  Toronto is not among them, so use hamilton-burlington or the province for
  type-level detail in the GTA.
- {BASE}/data/macro/all.json — rate-mortgage5y, rate-overnight, cpi-rent,
  unemp-canada, arrears-mortgage, starts-canada.

COMPUTE, for each of the six markets:
- Latest month's average price, sales, new listings, active listings, and the
  year-over-year % for each.
- Sales-to-new-listings and months of inventory, latest month.
- INDEXED TO JANUARY 2022 = 100 (latest ÷ Jan-2022 × 100). This single number
  is the spine of the report — it separates markets that recovered from markets
  that are still repairing, and it is the reason the comparison exists.
- Distance from each market's own peak: find the max of res.act.ap and its date.
- Average days on market now vs a year ago, where the board has unit data.

SEASONAL ADJUSTMENT — the one trap. CREA's press-release headlines are
seasonally adjusted. This feed serves not-seasonally-adjusted series. They are
different numbers for the same month. Use the feed's NSA figures for levels and
year-over-year change; if you quote a month-over-month change from CREA's
release, label it seasonally adjusted. Never compare one basis against the other.

STEP 3 — WRITE THE REPORT (900-1,400 words, SEO-optimized, in my stance):
- H1: "{Market} vs {Benchmarks}: {Month Year} Housing Market Report". Meta
  description under 155 characters with the market, month and one headline stat.
- Open with the comparison, not the nation: the indexed number for my market
  against the four benchmarks, in one sentence a client could repeat.
- PRICE: where my market sits against January 2022, against its own peak, and
  against the benchmarks. Say plainly whether the gap is widening or closing.
- VOLUME: sales year over year for all six. Distinguish "fewer sales because
  nobody is listing" from "fewer sales because nobody is buying" — new listings
  tell you which.
- SUPPLY: active listings and months of inventory. Use CREA's bands — under 3.6
  months is a seller's market, over 6.4 a buyer's, in between balanced — and say
  which band each of the six is in.
- DEMAND: sales-to-new-listings for all six, plus days on market where
  available. This is the leverage section: who has it, and is it moving?
- WHAT IT MEANS FOR MY AUDIENCE: the section that changes with Q3. Buyers want
  negotiating room and risk; sellers want pricing strategy and timing;
  investors want yield, supply pipeline and carrying cost. One honest risk,
  always.
- Close with a 3-question FAQ answered from the data ("Is {market} a buyer's
  market right now?", "Why is {benchmark} up when {market} is down?").

STEP 4 — EMBED THE LIVE CHARTS. NON-NEGOTIABLE:
- NEVER hand-draw a chart — no SVG, no CSS bars, no canvas, no image
  generation. A drawn chart is stale the day it ships and wrong the day after.
- Before publishing, fetch one embed URL and confirm it returns a chart page.
  If a chart cannot be embedded, use the {BASE}/api/chart PNG instead and tell
  me which one and why.
- {SIX} below means my two markets plus the four benchmarks, comma separated,
  slugs from the manifest. {ME} means my primary market's slug.

Interactive embeds — append &embed=1 to every one:
<iframe src="{BASE}/compare?g={SIX}&m=ap&base=202201&embed=1" style="width:100%;height:440px;border:0"></iframe>
<iframe src="{BASE}/yoy?g={SIX}&m=ap&from=202101&s=line&embed=1" style="width:100%;height:440px;border:0"></iframe>
<iframe src="{BASE}/explore?g={SIX}&m=snlr&from=202001&embed=1" style="width:100%;height:440px;border:0"></iframe>
<iframe src="{BASE}/explore?g={SIX}&m=moi&from=202001&embed=1" style="width:100%;height:440px;border:0"></iframe>
<iframe src="{BASE}/explore?g={ME}&m=us,nl&from=201901&embed=1" style="width:100%;height:440px;border:0"></iframe>
<iframe src="{BASE}/overlay?g={ME}&m=us&embed=1" style="width:100%;height:440px;border:0"></iframe>
<iframe src="{BASE}/macro?g={ME}&m=us&x=rate-mortgage5y&inv=1&mode=dual&from=201501&embed=1" style="width:100%;height:440px;border:0"></iframe>
<iframe src="{BASE}/balance?g={ME}&embed=1" style="width:100%;height:440px;border:0"></iframe>
<iframe src="{BASE}/seasonality?g={ME}&m=us&mode=value&embed=1" style="width:100%;height:440px;border:0"></iframe>
<iframe src="{BASE}/leaderboard?m=ap&mode=yoy&prov=1&embed=1" style="width:100%;height:520px;border:0"></iframe>
Property-type detail, where the board has unit data:
<iframe src="{BASE}/types?g={ME}&m=msp&t=det,twn,apt&from=201901&embed=1" style="width:100%;height:440px;border:0"></iframe>

Static images for email and social — same parameters, plus my branding. Append
&credit={my name or brokerage} and either &pal={preset} or &colors={hex,hex} to
EVERY image, exactly as chosen in Q5:
{BASE}/api/chart?view=compare&g={SIX}&m=ap&base=202201&w=1200&h=750&credit=...&pal=...
{BASE}/api/chart?view=yoy&g={SIX}&m=ap&from=202101&w=1200&h=750&credit=...&pal=...
{BASE}/api/chart?g={ME}&m=moi&from=201801&w=1200&h=750&credit=...&pal=...
Add &theme=dark for social; 1080x1080 for square posts. Use format=svg when I
need to edit the vector in Canva or Illustrator.

STEP 5 — DELIVER:
- The finished report: title, meta description, body with the live embeds in
  place, FAQ.
- An email version, 250-400 words, with three subject-line options and preview
  text.
- Three social captions, each leading with a number, under 5 hashtags.
- A one-paragraph "what I'd tell a client this week" summary in my stance.
Attribution on everything, exactly: "Data: CREA | homiesAI.com", with
homiesAI.com as a normal do-follow link to https://homiesai.com — in HTML:
<a href="https://homiesai.com">homiesAI.com</a>. Chart images carry "via
homiesAI.com" baked in; never crop or cover it. Prices are nominal, not
inflation-adjusted — say so where it matters.

Then ask me what to do next: publish, send the email, adapt it for another
market pair, or rebuild it next month. Prepare everything for my review. This
prompt authorizes drafting; do not send to my CRM/database, publish a campaign
or message recipients unless I explicitly authorize that action.
Want the single-market monthly version instead, with an optional lead-capture funnel and Instagram assets? That one lives on last month’s report . Both read the same feed.
September 2026
The September numbers
CREA released September on October 16. Sales fell 2.3% from August on a seasonally adjusted basis, new listings fell 1.8%, and the national composite MLS® Home Price Index slipped 0.4% to $652,800 — the first month of decline after four months of stability, and the first time since January that the annual HPI decline has grown larger rather than smaller.
Home sales
36,657
−7.7% yr/yr (actual) · −2.3% m/m (SA)
Average price
$666,538
−1.6% yr/yr · 19.4% below the Feb 2022 peak
New listings
88,186
−5.4% yr/yr · −1.8% m/m (SA)
Active listings
204,616
+1.8% yr/yr · a little above the long-run average
Sales-to-new-listings
41.6%
actual · 48.8% seasonally adjusted, from 49.1% in August
Months of inventory
5.6
actual · 4.9 SA · seller's <3.6 · buyer's >6.4
One note before the charts, because it is the easiest way to get this release wrong: CREA’s press-release headlines are seasonally adjusted, while this feed and every chart below are actual. They are different numbers for the same month. September’s sales-to-new-listings ratio is 48.8% seasonally adjusted and 41.6% actual — both correct, and comparing one against the other produces nonsense. Levels and year-over-year figures here are actual; anything month-over-month is labelled SA.
The thesis
Six cities, one chart
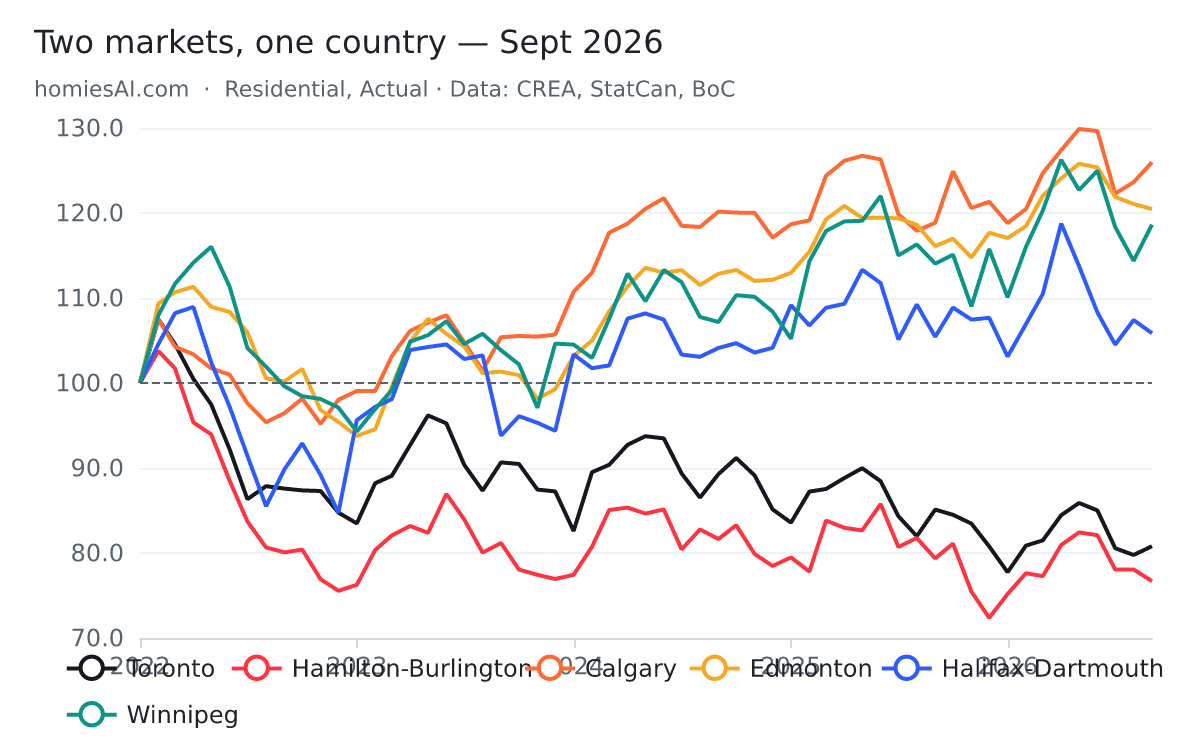
Start here. Index six cities to 100 in January 2022 — the month the market turned — and the entire national story resolves into one picture. Four and a half years on, these markets have not drifted back together. Hamilton-Burlington is at 77 and Calgary is at 126: a 49-point spread opened under one central bank and one set of mortgage rates.
Six cities, indexed to January 2022 — the chart the whole report hangs on
Hamilton-Burlington 77 · Toronto 81 · Halifax 106 · Winnipeg 119 · Edmonton 120 · Calgary 126
Every line starts at 100 in January 2022. Four and a half years later they have not converged — they have separated. Same country, same central bank, same mortgage rates, opposite outcomes. Nothing else on this page matters as much as the gap between the bottom two lines and the top three.
The same split at the provincial level
Ontario 78 · BC 89 · PEI 117 · Nova Scotia 119 · Alberta 119 · Saskatchewan 120 · Quebec 125 · New Brunswick 131 · Newfoundland 139
This is not a city story, it is a regional one. Ontario and BC are the only two provinces still below their January 2022 level. Newfoundland is 39% above it. The national average sits between them and describes neither.
The peaks tell the same story from another angle. Toronto and Hamilton-Burlington peaked in February 2022 and sit 24.8% and 26.1% below those highs. Calgary and Edmonton peaked in May 2026 — five months ago — and are 3.0% and 4.2% off. One pair is four and a half years into a correction; the other is a few months past a record.
Price
Price
Nationally the average sale price was $666,538, down 1.6% year over year and 19.4% below the February 2022 peak of $826,621. That national number is an artifact of averaging two opposite trends, which is why the ranked view below matters more than the headline.
Year-over-year price change across the six
Calgary and Edmonton positive · Toronto −5.1% · Hamilton-Burlington negative · Canada −1.6%
The national line is close to flat because the two halves cancel. Nobody lives in the average — a Burlington seller and a Calgary seller are having completely different years.
The national average against its own peak
$666,538 · peak $826,621 in February 2022 · −19.4%
Four and a half years after the peak the national average is still almost a fifth below it, in nominal dollars. Adjust for inflation and the hole is deeper — none of these figures are inflation-adjusted.
All 105 markets, ranked by year-over-year price change
48 of 105 up, 57 down — a month ago it was 55 up · Swift Current +20.9% · Bancroft −24.8%
Read the middle, not the ends: the extremes are small boards where a dozen sales move the average. The signal is that the country flipped from majority-up to majority-down this month, and almost every market that fell is in Southern Ontario or BC.
The most consequential number on this page is the one in chart five: 48 of 105 markets are up year over year, against 55 a month ago. The country crossed from majority-rising to majority-falling in September. That is a threshold, not a wobble — and it happened in the month fixed mortgage rates jumped.
Volume
Volume
36,657 homes sold on an actual basis, 7.7% fewer than September 2025 and the weakest September since 2019. But a sales count on its own cannot tell you why, and the why is different in different places.
National sales, one line per year
36,657 in September — below every September since 2019
Follow the 2026 line. The spring peak was the lowest of the five years and the autumn step-up never arrived. This is the fall market that did not show up.
Toronto sales and new listings together — the diagnostic chart
Sales −9.0% yr/yr · new listings −14.4% yr/yr
This is the most misread chart of the month. Toronto sales fell, but listings fell faster. That is not buyers capitulating — it is sellers withdrawing. A market where both sides step back quietly tightens even as the headline volume looks terrible.
Sales against the 5-year mortgage rate, inverted
The rate axis is upside down — up means cheaper money
Sales tracked cheap money up in 2020 and expensive money down in 2022. September's step back followed a jump in fixed rates, and CREA's own commentary flags the Bank of Canada as widely expected to hike before year-end. Treat that as CREA's stated expectation, not a forecast.
Chart seven is the one worth sitting with. In Toronto, sales fell 9.0% and new listings fell 14.4% — supply withdrew faster than demand. In Hamilton-Burlington the same pattern is sharper still: sales −15.8%, listings −18.0%. Compare Edmonton, where new listings rose 5.0% while sales fell 10.3%. Three markets, falling volume in all three, opposite causes. In the GTA sellers are refusing to transact at current prices; in Edmonton supply is arriving into softening demand. Those two situations resolve in completely different ways, and a report that only quotes the sales number cannot distinguish them.
Supply
Supply
Here is the tension in this month’s data. Sales fell. New listings fell. And yet the number of homes actually sitting on the market grew 1.8% year over year, to 204,616. Slower clearing beats reduced inflow.
Active listings — the number that did not fall
204,616 homes for sale · +1.8% yr/yr
Sales fell 7.7% and new listings fell 5.4%, but the standing inventory still grew. Unsold homes are accumulating slowly rather than clearing — the quiet mechanism behind soft prices in the south.
Months of inventory across the six
Calgary 4.1 · Edmonton 4.2 · Halifax 4.4 · Hamilton-Burlington 5.1 · Toronto 5.2 · Canada 5.6
CREA's bands put a seller's market under 3.6 months and a buyer's over 6.4. On an actual basis every one of these six is in the balanced band — but the two Ontario markets sit at the loose end of it and the Prairie pair at the tight end. Balanced is not the same as identical.
On an actual basis all six cities are inside CREA’s balanced band, but the spread within it is wide: Calgary at 4.1 months and Toronto at 5.2 are both “balanced” and feel nothing alike on the ground. Nationally, 5.6 months actual against 4.9 seasonally adjusted — the autumn gap between the two bases, which is exactly why mixing them misleads.
Demand
Demand & leverage
Sales-to-new-listings is the honest leverage measure: of every hundred homes newly listed, how many found a buyer. It is immune to the inventory-accumulation effects that make months-of-inventory jumpy in thin markets.
Sales-to-new-listings — who actually has leverage
Toronto 30.6% · Hamilton-Burlington 36.5% · Calgary 49.8% · Edmonton 50.3% · Halifax 59.7% · Winnipeg 59.7%
The cleanest leverage measure there is: of every hundred homes newly listed, how many sold. Toronto clears 31. Halifax and Winnipeg clear 60 — and land on the identical figure by coincidence, 1,148 of 1,923 and 434 of 727. Twice the absorption in Atlantic Canada and the Prairies as in the GTA.
Thirty years of seasonality in one heatmap
Rows are months, columns are years, colour is sales volume
Context for every “sales are down” headline. Spring is always the peak and September is always a step down from it; the question is only how big a step. 2021 glows for a full year. 2026 is the palest autumn in the series.
Toronto absorbs 31 of every 100 new listings. Halifax and Winnipeg absorb 60 — landing on the same 59.7% by pure coincidence, 1,148 sales from 1,923 listings in Winnipeg and 434 from 727 in Halifax. A Halifax seller is operating in a market with roughly twice the absorption of a Toronto seller’s, in the same month, under the same mortgage rates.
Composition
Underneath the average
Every figure above is an average across property types, and averages move when the mix moves. A market can post a falling “average price” in a month when no individual house got cheaper, simply because fewer expensive houses traded. The unit statistics — 75 boards, by type, monthly back to 2000 — are how you check.
Median price by property type, Hamilton-Burlington
Detached $785,000 · average days on market 42.8, three days slower than last September
Averages hide the mix. When detached, townhouse and condo diverge, a falling “average price” can simply mean fewer expensive houses traded. Toronto has no board-level type data in this feed, so Hamilton-Burlington is the closest clean read on the western GTA.
Days on market is the quiet corroborating signal this month: Hamilton-Burlington 42.8 days (three slower than last September), Edmonton 44.5 (five slower), Greater Vancouver 46.1 (three slower), Ottawa 39.3 (four slower). Everything is taking longer, including in the markets where prices are still rising.
Method
Method & sources
Figures come from the Canadian Real Estate Association’s September 2026 statistics package, released October 16, 2026, ingested into the Homies Stats feed the same day from CREA’s full aggregate and unit data tables. Every chart on this page is a live embed reading that feed — none is a screenshot, and all of them will show October’s data when October lands.
Levels and year-over-year changes are residential, actual(not seasonally adjusted), the same basis as CREA’s own board tables. Month-over-month changes quoted from CREA’s release are seasonally adjusted and labelled SA. The two bases are not interchangeable. Prices are nominal and not adjusted for inflation. Market-level averages in small boards are volatile — a dozen sales can move them several percent — which is why the ranked table is best read from the middle out. Index levels are average price in the latest month divided by the January 2022 value. Quebec’s average prices are supplied weighted by QPAREB.
Raw data: manifest · the prompt and full API · CREA national statistics
Planning and legal notice
Data sourced from CREA aggregate statistics and visualized by Homies Stats. This independent visualization tool is not affiliated with or endorsed by CREA. MLS® and the associated logos are trademarks of the Canadian Real Estate Association. Data is provided for information, not as investment advice.